
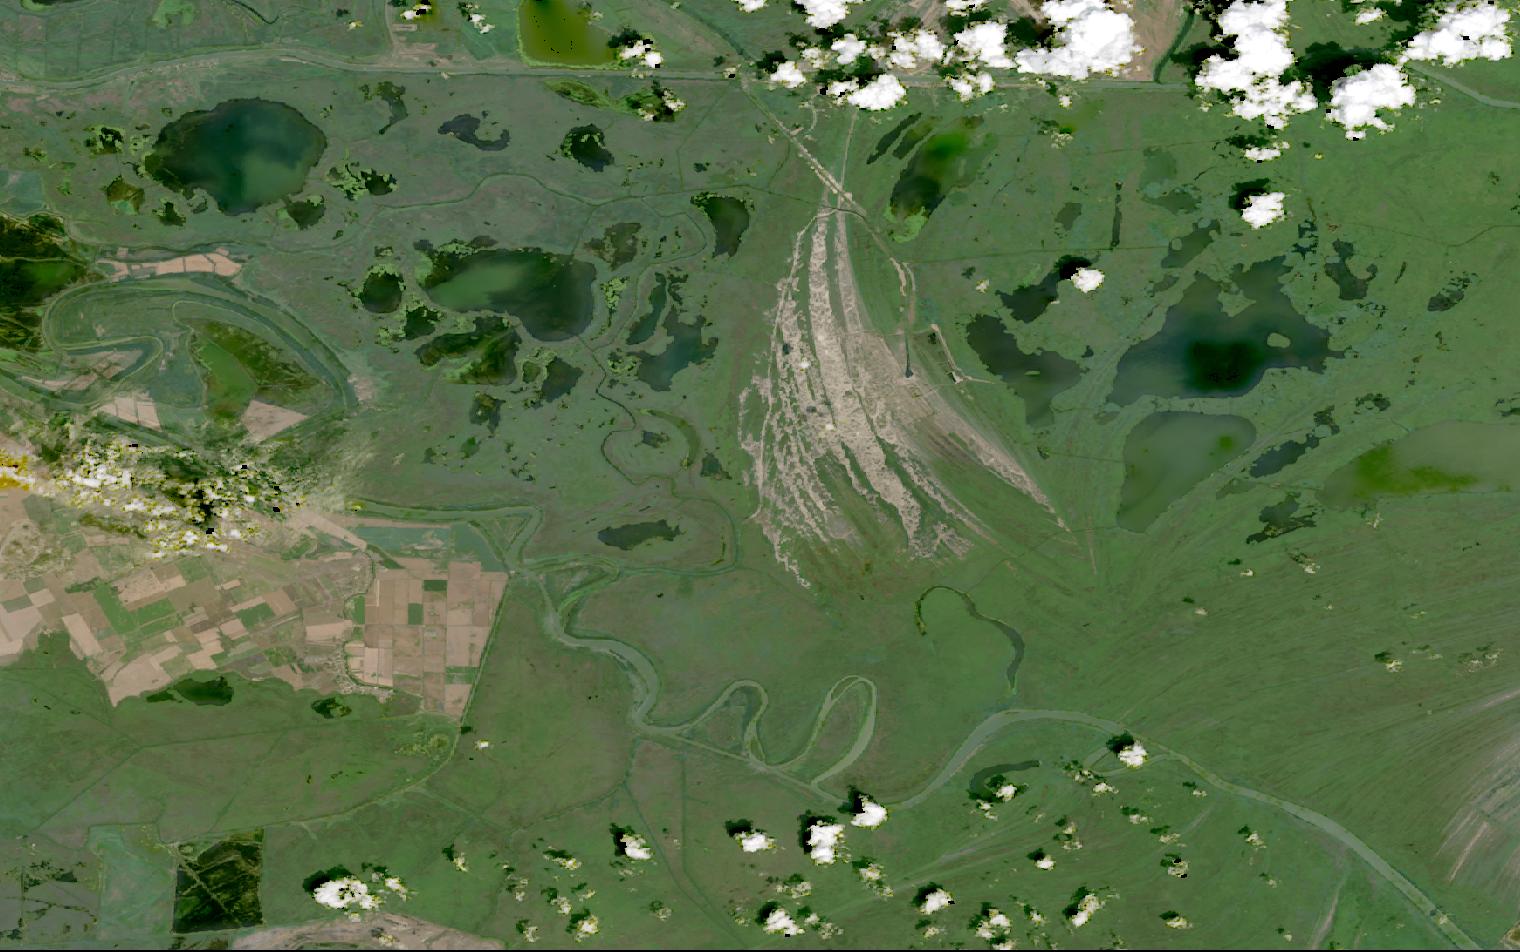
Reserves and restoration sites change across areas too large for ground surveys to cover.
Satellite data measures every hectare on the same schedule, letting teams see change, not estimate it.
This guide matches conservation tasks to the right data and provider.
Table of Contents
Key takeaways
- Conservation programs need frequent, wide-area monitoring that ground patrols cannot sustain alone
- The EU Nature Restoration Regulation ties national monitoring to satellite and Copernicus data by law
- The shortlist narrows once you need habitat classification versus a restoration-grade carbon baseline
Before any provider enters the picture, a conservation program has to settle what it needs from the data itself. The summary below sets out the sensors, resolution, and cadence that reserve and restoration monitoring depend on.
| Primary sensors | Multispectral optical, hyperspectral, SAR |
|---|---|
| Working resolution | 10-30 m routine, 0.3-5 m detailed |
| Typical revisit | Five days with Sentinel-2 |
| Core indices | NDVI, land cover class, aboveground biomass |
| Entry cost | Free with Sentinel-2, or from $2 per km² |
| Main constraint | Shows land cover, not individual species |
Those figures cover the baseline that most reserve-monitoring programs run on. Programs that go beyond it, through restoration carbon accounting or species-level surveys, change both the sensor mix and the cost.
How satellite data is used in conservation
Satellite data enters conservation programs at several distinct points, from national-level monitoring obligations through habitat mapping to reserve enforcement, each relying on a different sensor type and delivering a different form of decision support to conservation managers, funders, and regulators.
The EU Nature Restoration Regulation ties monitoring to Earth observation data
Regulation (EU) 2024/1991 has been in force since 18 August 2024, and it sets a Union target of restoring at least 20 percent of land areas and 20 percent of sea areas by 2030, with all ecosystems in need of restoration covered by 2050. Related targets include returning 25,000 km of rivers to a free-flowing state and contributing to the planting of 3 billion additional trees.
Article 16 sets a hard deadline: national restoration plans are due to the European Commission by 1 September 2026, under two months from when this guide was published. Article 20(9) goes further than most environmental law by sitting in the operative text rather than a preamble, requiring that member state monitoring systems maximize the access and use of data from remote sensing, Earth observation, and Copernicus services, alongside in-situ sensors and citizen science.
Two of the regulation’s own legal definitions, urban green space and urban tree canopy cover, are calculated directly from Copernicus Land Monitoring Service data, including the Tree Cover Density dataset. By 31 December 2028, the Commission is due to publish a guiding framework for satisfactory restoration levels.
The regulation stops short of prescribing a vendor or a resolution: it calls on member states to maximize the use of existing data sources, not to procure a specific commercial product, and open Copernicus data already covers much of that obligation. The wider international backdrop, the Kunming-Montreal Global Biodiversity Framework’s ambition to conserve 30 percent of the world’s land and sea areas by 2030, sits alongside this as context rather than as a binding requirement.
Monitoring reserves and wide landscapes at scale
A national park network or a transboundary conservation area can span millions of hectares, and a program watching for encroachment, fire, or sudden land-cover change needs imagery that revisits the same ground often enough to catch it early. Planet’s PlanetScope constellation captures near-daily global imagery at 3 to 3.7 m resolution, frequent enough to flag a new access road or clearing inside a reserve boundary within days.
Budget-constrained programs, researchers, and smaller conservation organizations often start from the open Copernicus archive instead. Sentinel Hub streams the free Sentinel-2 catalog, 10 m multispectral imagery on a five-day revisit, through a cloud API rather than a download queue, the same data source the Nature Restoration Regulation’s own monitoring provisions point to.
Classifying habitat and land cover for restoration baselines
Before a program can show that an ecosystem needs restoring, or that it has recovered, it needs a map of what covers the ground today and how that has shifted. Impact Observatory turns Sentinel-2 imagery into automated land-cover classification, offering a free 9-class global annual layer alongside a paid 15-class product at 10 m resolution for $2 per square kilometer, plus a 17-class, 3 m product built on PlanetScope imagery.
That kind of automated classification sits in the same product category the Nature Restoration Regulation’s own legal definitions rely on for tree canopy cover, applied here at the scale of a single reserve or landscape rather than an entire member state.
Measuring forest and ecosystem carbon for restoration effectiveness
A restoration project has to demonstrate gain, not just survival, which means tracking carbon stock over years rather than a single before-and-after pair of images. Chloris Geospatial publishes annual aboveground biomass stock and change maps reaching back to the year 2000 at 30 m resolution, with 10 m products also available, built from models trained on airborne and spaceborne LiDAR rather than optical vegetation indices alone. The same biomass measurement underpins corporate carbon claims, covered in our guide to satellite data for sustainability.
The company lists biodiversity and nature-positive monitoring, alongside nature-based-solutions due diligence, among its own use cases, which makes the same archive as relevant to a restoration site’s carbon claim as to a REDD+ project’s. A free Biomass Viewer gives programs a look at the 25-year archive before committing to an enterprise contract.
Detecting encroachment and habitat loss inside protected areas
A reserve boundary marked on a map is not the same as a reserve boundary respected on the ground, and illegal clearing or grazing often starts at the edge before it spreads inward. Satelligence runs its deforestation-alerting stack, Sentinel-2 optical fused with Sentinel-1 radar and calibrated against a commodity-corrected forest baseline, across the same open data that covers any forested reserve, not only land under agricultural supply-chain due diligence.
Detection accuracy is geography-dependent rather than a single figure a program can rely on everywhere, and any headline percentage is worth checking against results from the specific landscape being monitored. The radar component keeps the record continuous through the cloud cover that hides fresh clearings in many of the world’s most biodiverse forests.
Species detail, habitat structure, and what resolution cannot show
Separating one plant species from another, or one habitat type from a similar one nearby, is a spectral problem that standard multispectral bands cannot resolve on their own. Sfera Technologies brokers hyperspectral imagery from Wyvern at 5.3 m resolution across 31 spectral bands, aimed specifically at plant species differentiation rather than general land cover.
Planet’s Tanager satellite covers similar spectral ground at 30 m resolution with 424 narrow bands, built originally for methane detection but also applied to vegetation species mapping.
Fine physical structure is a separate axis from spectral detail. Airbus supplies Pléiades Neo imagery at 30 cm native resolution, sharp enough to delineate individual tree crowns or distinguish a footpath from a game trail, where 10 m habitat classification shows only a single vegetated pixel.
Counting animals from orbit is not impossible, but it is far narrower than it sounds. Researchers have identified whales in 30 cm imagery from WorldView and GeoEye, and the same approach works for elephants in open savanna. Both cases depend on a large-bodied animal against an uncluttered background, water or bare ground.
Under a canopy, in scrub, or for anything smaller than a car, the pixel simply does not resolve the animal. None of the providers on this page sells a wildlife census as a product, and a 10 m habitat map resolves neither a single tree nor a single animal.
Poaching patrols, population surveys, and habitat-quality assessment therefore remain field work that no resolution upgrade replaces, and the honest role of satellite data is to direct that field work to where the land is changing.
What satellite data you need for conservation
Different conservation tasks call for different sensor modalities, resolutions, and revisit frequencies. The table below maps each common task to the data specifications it requires.
| Task | Sensor modality | Resolution | Revisit | Key index / band |
|---|---|---|---|---|
| Habitat and land-cover classification | Multispectral optical | 10 m | Seasonal to annual | Land cover class, NDVI |
| Wide-reserve encroachment monitoring | Multispectral optical | 3-4 m | Near-daily | NDVI change, canopy loss |
| Cloud-persistent change detection | SAR (C-band) | 10-20 m | 6-12 days | Backscatter change |
| Restoration and biomass baselines | Optical and LiDAR fusion | 10-30 m | Annual | Aboveground biomass |
| Plant species differentiation | Hyperspectral | 5-30 m | Per season | Narrowband reflectance |
| Fine-scale habitat structure | Very high resolution optical | 0.3-1.5 m | On demand | Crown and canopy delineation |
| Inundation under wetland canopy | SAR (L-band, else C-band) | 10-25 m | 6-12 days | Double-bounce backscatter |
| Low-cost open-archive access | Multispectral optical | 10 m | Five days | NDVI, true color |
| Canopy height and terrain modeling | Stereo optical or radar DEM | 5-12 m | On demand | Canopy height model |
The radar row deserves a caveat, because wavelength decides what the sensor sees. NASA puts it plainly: X-band radar, at a wavelength near 3 cm, has very little capability to penetrate into broadleaf forest and interacts mostly with the leaves on top. L-band, at roughly 23 cm, reaches through the canopy to branches and trunks, which is what makes standing water beneath vegetation detectable at all.
That matters for procurement. The commercial radar operators sell X-band, so flooded-forest work leans on Sentinel-1 C-band as a partial compromise, or on public L-band missions. A vendor offering X-band for mangrove inundation is offering you a picture of the canopy.
With data requirements mapped, the next step is identifying which providers can supply them. The section below covers the most relevant options for conservation programs, from habitat classification services to raw imagery operators.
Satellite data providers for conservation
The providers below have documented conservation use cases and data products that map to the tasks in the table above. The mix spans satellite operators, analytics platforms, and multi-source access points.
| Provider | Type | Best for | Key conservation spec | Entry point |
|---|---|---|---|---|
| Planet | Satellite operator | Near-daily reserve monitoring | 3 m PlanetScope, daily revisit | Imagery from $2,700 per year |
| Impact Observatory | Analytics platform | Automated habitat classification | 15-class land cover at 10 m | From $2 per km² |
| Chloris Geospatial | Analytics platform | Restoration carbon baselines | Annual biomass since 2000, 30 m | From $5,000 per year |
| Satelligence | Analytics platform | Reserve encroachment alerts | Sentinel-1 and Sentinel-2 fusion | Demo request |
| Airbus | Satellite operator | Fine-scale habitat mapping | Pléiades Neo at 30 cm | Quote or UP42 marketplace |
| Sentinel Hub | Data platform | Free access to open archives | Sentinel-2 at 10 m | From $28 per month |
| Sfera Technologies | Multi-source access point | Plant species ID plus habitat data | Optical, SAR, hyperspectral | From $4 per km² optical |
For a ranked shortlist of providers by imagery type, our guide to the best satellite imagery providers covers the full market with head-to-head specifications.
How to choose satellite data for conservation
What I would settle before any procurement here is the baseline year. Restoration targets are measured against a past state, and if the archive does not reach back that far, no current sensor can reconstruct what was lost, however good it is.
The first decision is what the program has to prove. A habitat inventory and a restoration carbon claim are different products built from different inputs, and a vendor strong at one is rarely the cheapest route to the other. Habitat and land-cover classification is a mapping exercise on open imagery, while carbon and biomass work is a modeling exercise that lives or dies on calibration data.
Regulatory exposure sets the second cut. European programs preparing evidence for national restoration plans should treat Copernicus-based data as the baseline the regulation itself points to, and build outward from there. Programs without a regulatory deadline have more room to prioritize cost and coverage over compliance-grade documentation.
Geography decides the sensor mix. Optical monitoring works well where clear days are common, but in persistently cloudy tropical reserves, home to a disproportionate share of the world’s biodiversity, a fresh clearing can stay hidden under cloud for weeks. Programs in these regions should treat SAR as a core layer rather than a backup.
Data rights matter more for conservation than for many other verticals, because outputs often feed public reporting, donor disclosure, or a government monitoring system rather than staying inside one organization. Verify whether the provider’s standard license permits redistribution and public disclosure of derived maps before committing budget to a subscription.
Verdict
Conservation is the vertical where satellite data’s legal footing just got stronger. The Nature Restoration Regulation does not name a vendor, but it does require member state monitoring systems to maximize their use of Earth observation, and the national plans due by September 2026 will need a documented data source behind them.
Programs building a habitat baseline should start with Impact Observatory’s classified land cover or the open Sentinel-2 archive through Sentinel Hub, both of which map onto the kind of data the regulation’s own definitions already use. Restoration and carbon claims need a defensible biomass baseline, and Chloris Geospatial’s record back to 2000 is built for exactly that, while reserve managers watching for encroachment should add Satelligence’s fused optical-radar alerting or Planet’s near-daily archive.
Programs that need several of these data types under one relationship, rather than several vendor contracts, gain from a single access point such as Sfera Technologies. For a full ranked view of the imagery market, see our satellite imagery providers guide, and bring in hyperspectral or very high resolution imagery only where species differentiation or fine habitat structure actually drives the decision.
Frequently asked questions
Below are answers to the questions conservation buyers most commonly ask. Each answer points to the section where the full detail lives.
How is satellite data used in conservation?
Satellite data supports conservation through national restoration monitoring, wide-area reserve surveillance, habitat classification, restoration carbon accounting, encroachment detection, and species-level mapping. Each application relies on a different sensor type and delivers a different form of decision support to reserve managers, funders, and regulators. The full breakdown is in “How satellite data is used in conservation“.
Does the EU Nature Restoration Regulation require satellite data?
The regulation requires member state monitoring systems to maximize their use of remote sensing, Earth observation, and Copernicus data, but it does not name a commercial vendor or a required resolution. National restoration plans are due to the European Commission by 1 September 2026. The requirement is covered in “How satellite data is used in conservation“.
Can satellites tell you if a habitat is being restored?
Satellites can show whether vegetation cover, canopy density, or aboveground biomass is increasing over time, which is the core evidence a restoration project needs. They cannot confirm which species have returned or how a habitat’s ecological quality has changed without field verification alongside the imagery. The approach is described in “How satellite data is used in conservation“.
What resolution do I need for conservation monitoring?
Routine habitat classification and biomass monitoring run at 10 to 30 m, which is what the open Sentinel-2 and Landsat archives deliver. Species differentiation needs hyperspectral data at 5 to 30 m, and fine habitat structure such as individual tree crowns needs 0.3 to 1.5 m very high resolution optical. The full task-to-resolution mapping is in “What satellite data you need for conservation“.
Which satellite data providers are best for conservation?
Impact Observatory and Sentinel Hub lead on habitat and land-cover mapping, Chloris Geospatial covers restoration-grade carbon and biomass, and Satelligence and Planet cover wide-area encroachment monitoring. Airbus and Sfera Technologies add the very high resolution and hyperspectral imagery that species-level work needs. Provider details and access models are in “Satellite data providers for conservation“.
Can satellites replace field surveys for wildlife and biodiversity?
Satellite resolution cannot resolve an individual animal, and satellites measure land cover and vegetation structure rather than confirming species presence directly. Wildlife counts, poaching patrols, and on-the-ground habitat quality assessments remain field work that satellite data directs rather than replaces. The trade-off is discussed in “How to choose satellite data for conservation“.

My passions are Earth Observation and Satellites, and my profession is Data Analysis. I combine both within ObservationData.com to show you the use cases of Earth Observation, to help you find the right provider, and to share your experiences.
