
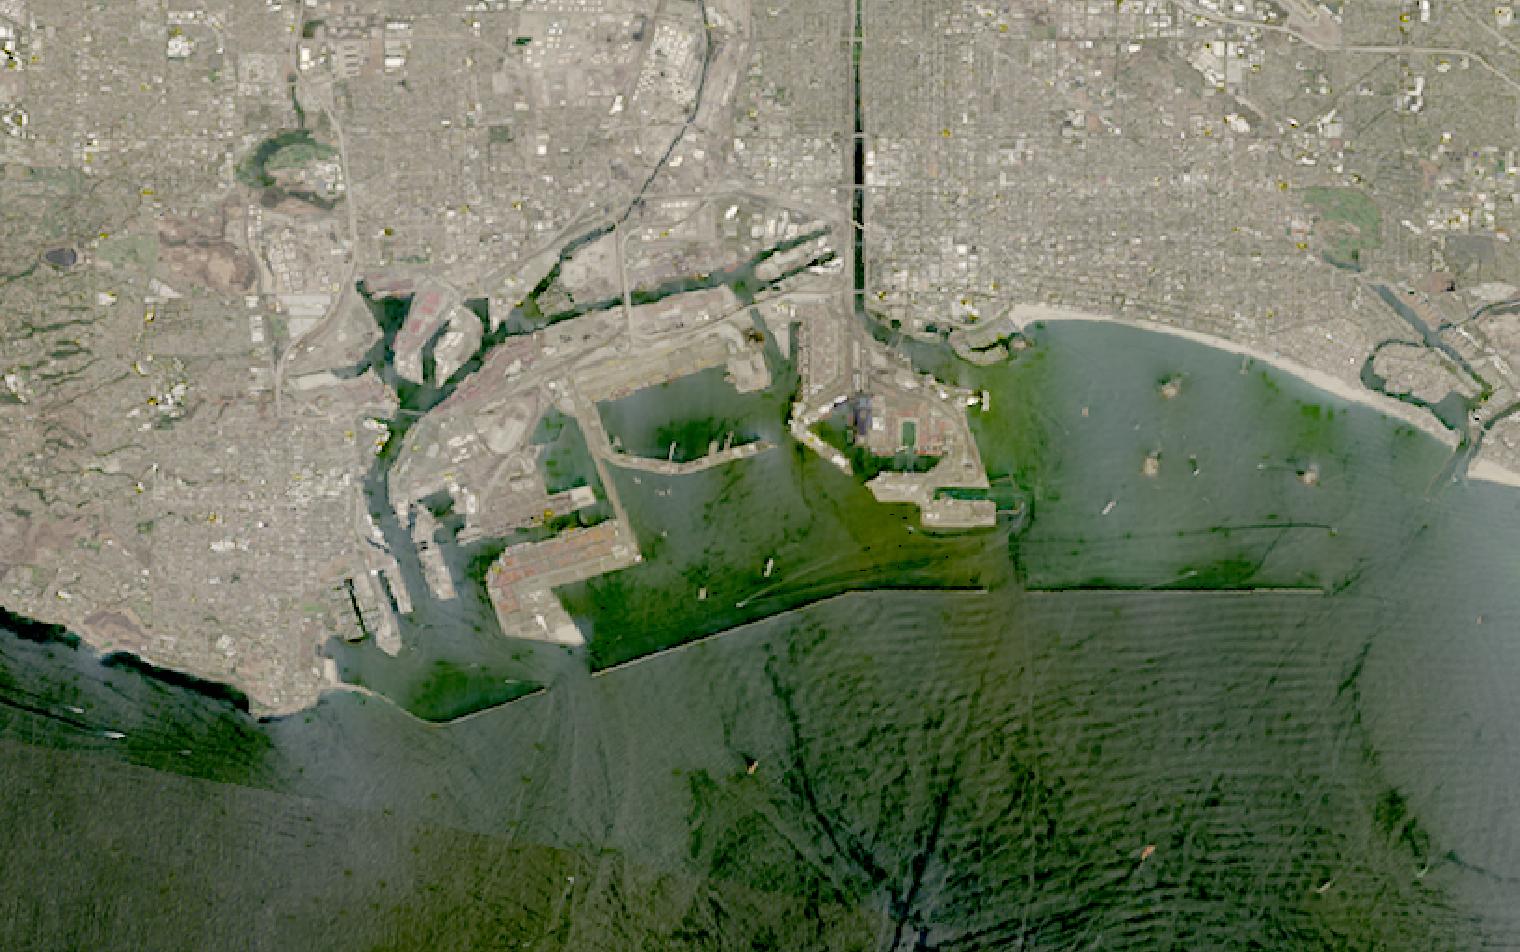
Ground counts cannot cover every port, every day, yet traders need to see what moves.
Satellite imagery watches the same terminal on schedule, giving a repeatable, wide-area record.
This guide matches logistics tasks to the right data and provider.
Table of Contents
Key takeaways
- Logistics programs need trade-flow data at least as much as imagery to see what is actually moving
- A satellite counts the containers and AIS names the ship, but only customs and manifest data show the cargo
- The shortlist narrows fast once you know whether you need terminal-level imagery or a vessel-tracking feed
Before any provider enters the picture, a logistics program has to settle what it needs from the data itself. The summary below sets out the sensors, resolution, and cadence that terminal and trade-flow monitoring depends on.
| Primary sensors | Very high-resolution optical, AIS, customs data |
|---|---|
| Working resolution | 0.3-0.5 m for container and vehicle counts |
| Typical revisit | Sub-daily with tasked VHR imagery |
| Core indices | Vessel ETA, berth occupancy, container count |
| Entry cost | Imagery from $2,700 per year |
| Main constraint | Imagery shows the count, not the cargo manifest |
Those figures cover the baseline that most terminal and trade-flow programs run on. Programs that lean harder into vessel-level forecasting or disruption detection change both the sensor mix and the cost.
How satellite data is used in logistics
Satellite data enters logistics programs at five distinct workflow stages, each relying on a different data type and delivering different decision support to port operators, traders, and freight planners.
Port and terminal utilization
Port authorities and commodity desks want to watch the same terminal, berth, or tank farm on a fixed schedule rather than wait for a port-call report or a customs filing. Vantor’s Sentry product is built for exactly that repetition, running continuous change detection across hundreds of sites at once and flagging a shift against a rolling baseline instead of a single snapshot.
Kpler folds the same terminal into a wider picture, fusing port and terminal data with refinery throughput and storage-tank levels across its global inventories coverage, so a trading desk sees congestion building before a vessel queue forms.

Counting containers and vehicle inventories
Resolving one container or one vehicle on the ground takes very high-resolution optical imagery, not the coarser multispectral tiles used for crop or forest monitoring. Planet’s SkySat tasks at 50 cm resolution on a sub-daily schedule, fine enough to separate one container stack from the next across a full terminal.
Vantor’s WorldView constellation works the same problem at its 30 cm-class product tier, with up to 15 imaging opportunities a day over the same yard, useful when a stockpile or a vehicle lot turns over within hours rather than days.
None of that resolves what is inside the box. A satellite counts containers on a stack, or vehicles in a lot, but it has no way to read a manifest or a cargo declaration, and an image captured every few days does not describe a supply chain that turns over in hours.
AIS positions and customs filings are cheaper and more precise for tracking what is actually moving, and imagery earns its place only where a shipper does not transmit a position or a customs entry goes unfiled. Cloud cover compounds that gap in monsoon-season ports, breaking an optical time series exactly where congestion runs worst.
Vessel traffic and arrival forecasting
Predicting when a vessel actually reaches berth is a fusion problem, not an imaging one. Kpler tracks more than 661,000 vessels a day across a combined terrestrial and satellite AIS network, turning raw position reports into port-call and berth-arrival forecasts that a customs filing alone cannot produce.
Windward runs a similar position stream through behavioral AI instead of raw tracking, flagging the AIS gaps, spoofed positions, and course changes that often precede a late arrival, then feeding a predicted ETA into its own container-tracking product.
Arrival forecasts also depend on the ocean itself. Spire Global’s GNSS radio occultation data feeds the weather models that shipping lines use for voyage routing and vessel-performance planning, refreshed daily on a global atmospheric profile rather than a single regional forecast.
Disruptions and rerouting on trade routes
The exposure here is larger than any single shipper’s. UNCTAD’s Review of Maritime Transport puts around 80 percent of world goods trade by volume on the water, and higher again for most developing economies, which is why a chokepoint reads as a macro event rather than a shipping one.
A trade route rarely fails all at once. Vessels bunch at a chokepoint, dwell times stretch at a terminal, or a whole corridor empties out, and each of those patterns shows up in AIS density before a single shipment is confirmed late.
Kpler’s Supply and Demand module backtests its flow data against official statistics such as JODI and the EIA’s weekly petroleum stocks, giving a trading desk a baseline to measure a disruption against rather than reacting to the first headline.
Windward’s behavioral models were built for a related problem, originally flagging the AIS spoofing and ship-to-ship transfers used in sanctions evasion, and the same anomaly pattern often marks a blocked route or a diverted call. Vessel-level enforcement, including dark-vessel detection, is the subject of our separate satellite data for maritime guide. This section stays on the trade-flow side of the same ships.
Warehouse and storage yard monitoring
A distribution yard or a container depot changes faster than most other logistics assets, and a subscription that revisits the same footprint on a fixed cadence catches that turnover better than an annual survey. Ursa Space runs this kind of analysis on radar imagery it buys rather than flies, measuring floating-roof tank inventories and iron ore stockpiles at ports on a repeating schedule.
Planet’s own imagery supplies part of that same pipeline. PlanetScope revisits a defined area under management once a day at 3 to 3.7 meter resolution, cheap enough to run as a standing subscription over a whole distribution network rather than tasking each site individually.
What satellite data you need for logistics
Different logistics tasks call for different sensor modalities, resolutions, and revisit cadence, and getting that mix wrong wastes budget on the wrong spec. The table below maps each common task to the data requirements it actually demands.
| Task | Sensor modality | Resolution | Revisit | Key index / band |
|---|---|---|---|---|
| Port and terminal utilization | Very high-resolution optical | 0.3-1 m | Sub-daily to daily | Berth and yard occupancy |
| Container and vehicle counts | Very high-resolution optical | 0.3-0.5 m | Per tasking request | Object count, change detection |
| Vessel position and ETA | Satellite and terrestrial AIS | Exact position report | Continuous | Port calls, berth arrival |
| Trade-route disruption | AIS, customs, and imagery fusion | N/A | Continuous | Congestion and rerouting signal |
| Storage yard and warehouse fill | Very high-resolution optical | 0.3-3 m | Weekly to monthly | Stockpile footprint, change |
| Ocean weather for voyage routing | GNSS radio occultation | Global atmospheric profile | Daily | Atmospheric and ocean forecast |
With the data requirements mapped, the next step is finding which providers actually supply them. The section below covers the operators and analytics platforms most relevant to logistics programs, from very high-resolution tasking to trade-intelligence fusion.
Satellite data providers for logistics
The providers below have documented logistics use cases that map to the tasks above, spanning satellite operators, a multi-payload weather and RF operator, and the trade-intelligence platforms that fuse AIS with customs and imagery data.
| Provider | Type | Best for | Key logistics spec | Entry point |
|---|---|---|---|---|
| Planet | Satellite operator | Near-daily port monitoring | PlanetScope 3 m, near-daily | Imagery from $2,700 per year |
| Vantor | Optical satellite operator | VHR container and vehicle counts | 30 cm-class, up to 15 revisits/day | Quote or UP42 marketplace |
| Spire Global | Multi-payload satellite operator | Ocean weather for voyage routing | Global daily atmospheric profiles | Talk to sales |
| Kpler | Data aggregator | Vessel ETA and cargo flow tracking | 661,000+ vessels tracked daily | Demo request |
| Ursa Space | SAR analytics aggregator | Port stockpiles and tank inventory | Radar analytics, all-weather | Contact for pricing |
| Windward | Analytics platform | Container tracking and ETAs | 30+ data sources fused by AI | Enterprise contract |
For a full ranked comparison of the imagery side of this market, see our guide to the best satellite imagery providers, which scores every operator on resolution and tasking speed. Programs leaning on trade-intelligence fusion instead of raw pixels should treat Kpler and Windward as a separate shortlist, closer to a data platform than an imagery order.
How to choose satellite data for logistics
The first decision is what the data has to prove. A single terminal snapshot and a standing trade-flow feed are different products, and a vendor strong at one rarely gives you the other. Counting containers on a stack is a tasking exercise on very high-resolution optical, while predicting a vessel’s arrival is a fusion exercise across AIS, customs, and weather data.
Geography decides the sensor mix next. A distribution network that spans a monsoon coastline loses weeks of usable optical imagery a year to cloud cover, so a standing subscription needs either a tolerance for gaps or a fallback to AIS and customs data that keeps reporting regardless of the sky.
Budget and coverage area follow from how continuously you actually need to watch. A standing subscription over a busy port or a whole distribution network costs less per observation than one-off tasking, while a single count of one yard on one day is the case for on-demand tasking instead of an area-wide contract.
Data rights matter here in the same way they do elsewhere in commercial intelligence. Confirm whether your intended use, including trading decisions, public disclosure, or a counterparty dispute, is permitted under the provider’s standard license before committing budget to a full trade-flow subscription.
Verdict
Logistics is the vertical where the choice between imagery and trade data matters most. A satellite image proves what was sitting in a yard on the day it was captured. An AIS and customs feed shows where everything is moving right now, and most programs end up needing both, at different points in the same decision.
Teams that need a physical count, a terminal snapshot, or a change-detection alert should look first at Planet and Vantor, whose very high-resolution tasking resolves individual containers and vehicles. Teams building continuous trade-flow awareness get more out of Kpler and Windward, whose value is years of fused AIS and customs history rather than a single image.
Spire Global sits alongside both groups, feeding the ocean weather data that turns a vessel position into a reliable arrival forecast rather than a rough estimate. None of these providers reads a container seal. Imagery describes the box and the berth, AIS describes the vessel, and only customs filings and bills of lading describe the goods, which is why commodity desks buy all three.
For a full ranked view of the imagery market, see our satellite imagery providers guide, which scores every operator on resolution and tasking speed.
Frequently asked questions
Below are answers to the questions logistics buyers most commonly ask. Each answer points to the section where the full detail lives.
How is satellite data used in logistics?
Satellite data covers five main workflows: port and terminal utilization, counting containers and vehicles, vessel traffic and arrival forecasting, trade-route disruption detection, and warehouse or storage yard monitoring. Each workflow draws on a different data type, from very high-resolution imagery to fused AIS and customs records. The detail is in “How satellite data is used in logistics“.
Can a satellite tell me what is inside a container?
No. A satellite image resolves the shape and count of containers or vehicles on the ground, but it carries no information about cargo contents. That detail comes from a bill of lading, a customs declaration, or a booking record, not from a picture. This limitation is covered in “How satellite data is used in logistics“.
What resolution do I need to count containers or vehicles?
Counting individual containers or vehicles needs very high-resolution optical imagery in the 0.3 to 0.5 meter class, the tier Planet’s SkySat and Vantor’s WorldView constellation both operate in. Broader terminal-utilization trends can run on coarser, more frequent imagery instead. The full task-to-resolution mapping is in “What satellite data you need for logistics“.
Which satellite data providers are best for logistics?
Planet and Vantor lead on very high-resolution tasking for terminal and yard imagery, Kpler and Windward lead on fused vessel and trade-flow intelligence, and Spire Global adds the ocean weather data that arrival forecasts depend on. Which one fits depends on whether you need a picture or a feed. Provider details and access models are in “Satellite data providers for logistics“.
Why not just use AIS and customs data instead of satellite imagery?
AIS and customs data are cheaper and more precise for most trade-flow questions, and they should be the default choice. Imagery earns its place only where a vessel or shipper is not reporting a position or a filing, or where a physical count at a single site is the actual deliverable. This trade-off is discussed in “How to choose satellite data for logistics“.
How does cloud cover affect logistics monitoring?
Optical imagery cannot see through cloud, which breaks a monitoring time series exactly in the monsoon-season ports where congestion tends to run worst. A standing subscription over a cloud-prone coastline needs either a higher revisit budget or a fallback to AIS and customs data that keeps reporting regardless of the weather. Geography-driven sensor choice is covered in “How to choose satellite data for logistics“.

My passions are Earth Observation and Satellites, and my profession is Data Analysis. I combine both within ObservationData.com to show you the use cases of Earth Observation, to help you find the right provider, and to share your experiences.
