
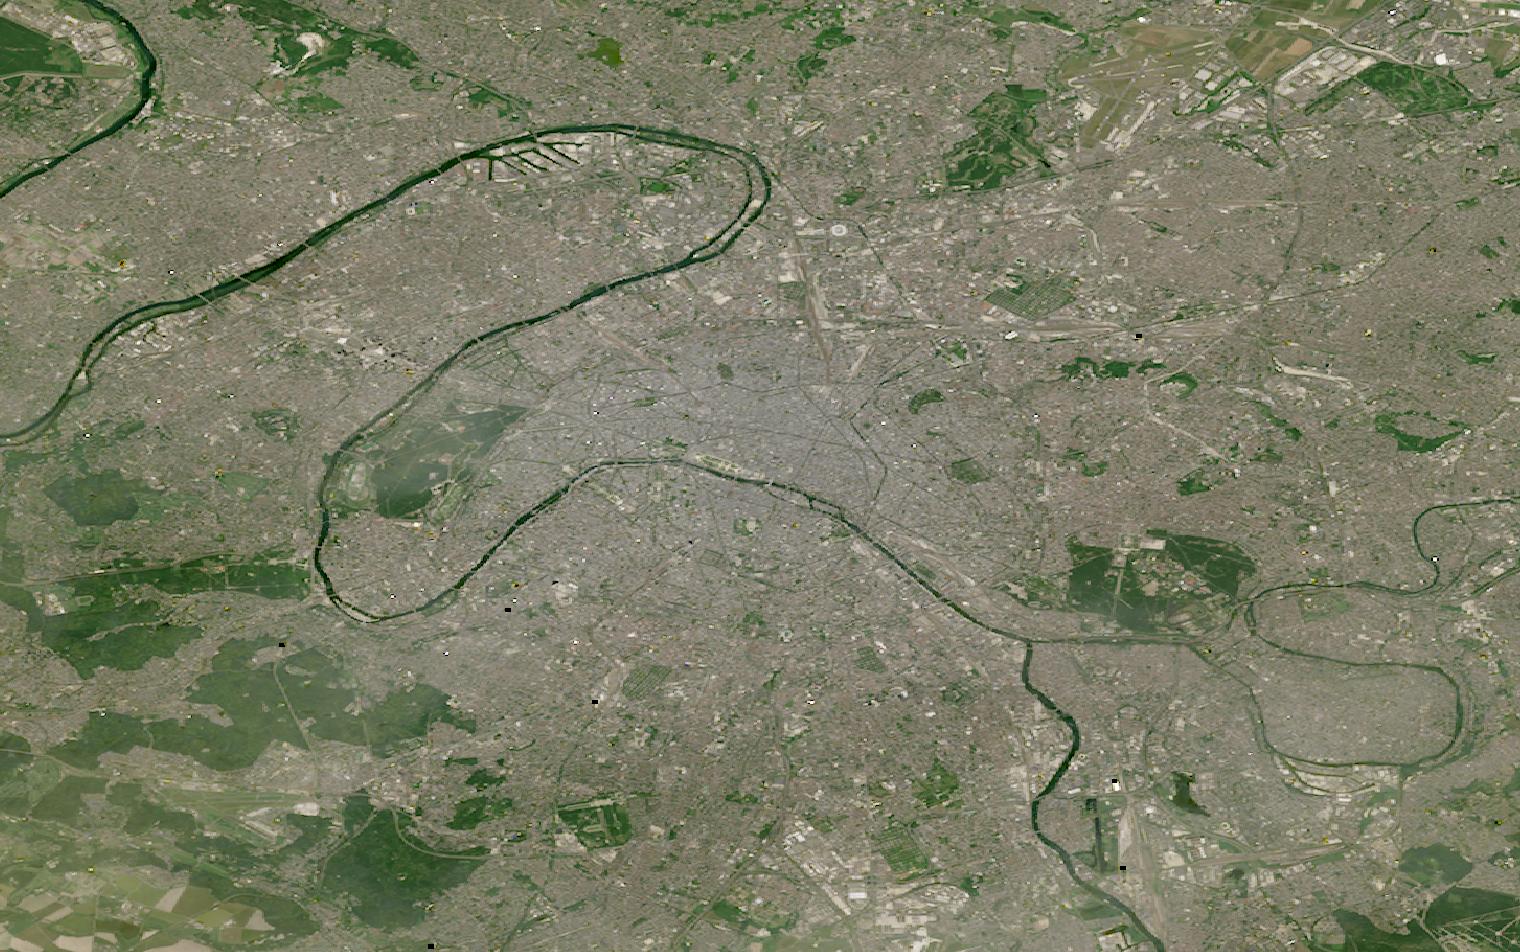
Construction and land-use change outpace permit records and field inspections across a city.
Satellite imagery measures the same city repeatedly, turning growth, density and green cover into data.
This guide matches urban planning tasks to the right data and provider, at a planning department’s budget.
Table of Contents
Key takeaways
- Urban planning programs get repeatable, citywide measurement that no manual survey can match
- Basemaps and footprints run on sub-meter optical, but proving canopy trends needs a dated archive reaching back to 2024
- Choosing a provider comes down to refresh frequency versus one-off VHR tasking for a single decision
Before any provider enters the picture, an urban planning department has to settle what it needs from the data itself. The summary below sets out the sensors, resolution, and cadence that routine city monitoring depends on.
| Primary sensors | VHR optical, multispectral, thermal infrared |
|---|---|
| Working resolution | 10-30 m regional, 0.3-1 m site-level |
| Typical revisit | Five days with Sentinel-2 |
| Core indices | NDVI, impervious surface, land surface temperature |
| Entry cost | Free with Sentinel-2, or from $28 per month |
| Main constraint | Nadir imagery shows roofs, not facades |
Those figures cover the baseline that most planning departments run on. Programs that depart from it, through green space compliance, heat mapping, or 3D city modeling, change both the sensor mix and the cost.
How satellite data is used in urban planning
Satellite data enters urban planning programs at five distinct workflow stages, each relying on different sensor types and delivering different forms of decision support to planning departments, GIS teams, and compliance officers.
Tracking urban growth and land use change
Fast-growing cities add rooftops and roads faster than a planning department can update a zoning map by site visit alone. A repeat optical pass over the same area, run on a fixed schedule, turns that growth into a measurable trend rather than an impression.
Planet’s SuperDove constellation captures the whole planet at 3 to 3.7 meters resolution on a near-daily basis, a cadence built for catching new construction and informal settlement expansion as it happens rather than at the next survey cycle.
For land-use classification at city or regional scale, Sentinel Hub streams the free Sentinel-2 archive alongside Copernicus Land Monitoring Service products, including Corine Land Cover and Global Land Cover, without a licensing negotiation for the underlying satellite data.
Building footprints, 3D city models, and basemaps
A current basemap is the layer every planning decision sits on top of, and it ages the moment a new subdivision breaks ground. Nearmap flies its own aircraft over 1,973 urban and regional areas across the US and Canada, plus additional coverage in Australia and New Zealand, refreshing each one up to three times a year at 4.4 to 7.5 centimeter resolution.
Outside Nearmap’s covered metros, a satellite-based basemap fills the same role. Vantor refreshes 135 million square kilometers of 30 centimeter imagery on a rolling cycle through its Vivid Mosaic product, with 15 centimeter processing available over the world’s most populous areas.
Ecopia AI does not capture imagery. It applies artificial intelligence to imagery from partner operators, extracting building footprints and land-cover features at scale, and its Building-Based Geocoding product covers more than 180 million US buildings, updated every year and guaranteed above 97 percent accuracy under contract.
Where a project needs elevation rather than a flat image, Airbus derives its WorldDEM Neo product from its own radar satellites at 5 meter posting and 1.4 meter vertical accuracy, while Vantor’s Vivid Terrain reaches 3 meter accuracy in all dimensions across more than 100 million square kilometers, enough for shadow studies and drainage modeling.
Proving green space and canopy trends under the Nature Restoration Regulation
The EU’s Nature Restoration Regulation sets a dated target for cities. By 31 December 2030, member states must show no net loss in total national urban green space and tree canopy cover, measured against a 2024 baseline, with an exemption for areas where green space already exceeds 45 percent and canopy already exceeds 10 percent.
From 1 January 2031, the bar rises again: both metrics must show an increasing trend, measured every six years. The Regulation defines both terms itself as figures calculated from the Copernicus Land Monitoring Service, with tree canopy cover tied specifically to its Tree Cover Density dataset.
The Regulation only entered into force on 18 August 2024, after the baseline date it references. A member state starting to measure in 2026 has to reconstruct what 2024 looked like from the archive, and Sentinel Hub’s Sentinel-2 access reaches back to 2015, well before that reference point, alongside direct access to Copernicus Land Monitoring Service land cover layers.
None of this is a purchase order. The Regulation obligates member states, not individual cities, and names no vendor, resolution, or minimum spend. What it settles is the yardstick, since whoever performs the measurement has to use Copernicus Land Monitoring Service data to do it.
Mapping urban heat islands
Heat does not distribute evenly across a city. Asphalt and dense rooftops run several degrees hotter than tree-covered blocks a few streets away, and that gap stays invisible to a standard optical image no matter how sharp it is. Thermal infrared sensors measure the surface temperature difference directly.
Sfera Technologies aggregates two thermal sources for exactly this purpose. SatVu’s mid-wave infrared satellites resolve surface temperature at about 3.5 meters, fine enough to separate a rooftop from the street beside it, while Aistech’s long-wave infrared payload trades resolution for a wider footprint.
Neither feed replaces the green space and canopy data that Copernicus-based measurement supplies. A heat map explains where and why a neighborhood runs hot, which is a different planning question than a canopy percentage on its own can answer.
Transportation networks and infrastructure planning
Road safety and transit planning need more than a road centerline. Curb cuts, medians, bike lanes, and sidewalk gaps determine whether a corridor is safe to cross on foot, and vector-level detail extracted from imagery answers that at a scale no field survey team covers in a single budget cycle.
Ecopia AI’s Advanced Transportation Features product extracts exactly that detail, road networks, bike lanes, curbs, medians, and sidewalk infrastructure, from partner imagery, feeding directly into Vision Zero pedestrian safety initiatives that many transportation departments now run.
For a single corridor study or a new interchange design, tasked very high-resolution optical from Airbus or Vantor delivers a current, sub-meter view of a specific site rather than a nationwide feature layer, useful when the question is one intersection rather than the whole network. The same Copernicus tree canopy layer underpins the wider habitat work described in our guide to satellite data for conservation.
What satellite data you need for urban planning
Different urban planning tasks call for different sensor modalities, resolutions, and revisit frequencies. The table below maps each common task to the data specifications it requires.
| Task | Sensor modality | Resolution | Revisit | Key index / band |
|---|---|---|---|---|
| Urban growth monitoring | Multispectral optical | 3-10 m | Near-daily to 5 days | Built-up index, NDVI change |
| Land use and land cover classification | Multispectral optical | 10-30 m | Seasonal to annual | Land cover class, NDVI |
| Building footprint extraction | High to very high-resolution optical | 0.3-1 m | Annual | Building vector, height |
| 3D city modeling and elevation | Stereo optical and DEM | 0.5-5 m | On demand | DSM, DTM, building height |
| Basemap refresh | VHR satellite or aerial optical | 4-30 cm | Multiple times per year | True-color RGB, pan-sharpened |
| Urban green space and canopy | Multispectral optical | 10-20 m | Annual | NDVI, Tree Cover Density |
| Urban heat island mapping | Thermal infrared | 3.5-39 m | As needed | Land surface temperature |
| Road and sidewalk network extraction | Very high-resolution optical | 0.3-1 m | Per project | Road, curb, sidewalk vector |
| Zoning and permit change detection | VHR optical | 0.3-1 m | As needed | Change detection |
With data requirements mapped, the next step is identifying which providers can supply them. The section below covers the most relevant options for urban planning programs, from basemap aggregators to VHR tasking operators.
Satellite data providers for urban planning
The providers below have documented urban planning use cases and data products that map to the tasks in the table above. The mix spans satellite operators, an aerial imagery provider, an analytics platform, and a multi-source access point.
| Provider | Type | Best for | Key urban spec | Entry point |
|---|---|---|---|---|
| Airbus | Satellite operator | City-scale VHR tasking | Pléiades Neo at 30 cm | Quote or UP42 marketplace |
| Vantor | Optical satellite operator | Citywide 3D terrain models | Vivid Terrain at 50 cm | Quote or UP42 marketplace |
| Nearmap | Aerial imagery provider | Frequent city-wide basemaps | 4.4-7.5 cm aerial GSD | Contact sales |
| Ecopia AI | Analytics platform | Building and land-cover vectors | 180M+ US footprints, 97%+ accuracy | Data Portal by request |
| Planet | Satellite operator | Near-daily urban growth tracking | 3.7 m PlanetScope, near-daily | Imagery from $2,700 per year |
| Sentinel Hub | Data platform | Free to low-cost city archive | Sentinel-2 at 10 m, since 2015 | From $28 per month |
| Sfera Technologies | Multi-source access point | Optical, thermal & hyperspectral | Includes SatVu/Aistech thermal | From $4 per km² optical |
For a ranked shortlist of providers by resolution and price, our guide to the best high-resolution satellite imagery providers covers the wider optical market head-to-head.
How to choose satellite data for urban planning
My concern in urban programs is the comparison baseline. A no-net-loss target is meaningless without a defensible earlier state, so the practical work is reconstructing that baseline from archive data before anyone measures a trend.
The first decision is what the deliverable actually is. A department refreshing its basemap on a schedule and a team tasking a single site for a rezoning decision need different products from different providers, and a vendor strong at one is rarely the cheapest route to the other.
Geography narrows the field quickly. Nearmap’s aerial coverage runs across the US, Canada, Australia, and New Zealand only, so a department outside those markets needs a satellite-based basemap instead, whether that is Vantor’s Vivid Mosaic, Airbus’s tasked archive, or Sentinel Hub’s entry point into the open Sentinel-2 data.
Regulatory exposure changes what actually matters. A city working toward Nature Restoration Regulation compliance needs archive depth reaching back to 2024, not the sharpest resolution on the market, which points toward a platform with a long, continuous record rather than a one-off VHR tasking order.
Budget and area follow from how often the picture needs to change. Continuous citywide monitoring is cheaper on an area subscription than on per-scene ordering, while a single rezoning case or a one-off elevation model is the case for tasked, per-order imagery without an annual commitment.
Data rights matter more for a public agency than for most private buyers. Verify whether the standard license permits publishing derived maps on a public planning portal or open data site before committing, since several commercial licenses restrict redistribution to internal use only.
A satellite sees rooftops and tree crowns, not people. It cannot show population density, vacancy, or the social infrastructure behind a building’s facade, and a department that needs those figures needs administrative and census data, not another image.
Street-level detail runs into a different ceiling. Curb ramps, signage, and pavement condition resolve better from aerial survey or mobile mapping than from any satellite image, since a nadir view hundreds of kilometers up still cannot see the side of a curb.
Verdict
Urban planning draws on more of the imagery market than most verticals. Basemaps, elevation, thermal, and vector features all play a role, and no single provider in this list covers every one of those needs at once.
Departments that need a current, wide-area basemap should start with Vantor’s Vivid Mosaic or, inside its covered countries, Nearmap’s frequent aerial refresh. Cities working toward Nature Restoration Regulation compliance get more from Sentinel Hub’s long Sentinel-2 archive and direct Copernicus Land Monitoring Service access than from a single high-resolution tasking order.
Ecopia AI is the strongest fit for building footprint and transportation vector layers, and Airbus covers one-off VHR tasking and elevation modeling for a specific site.
Programs that need several of these capabilities at once, a basemap, a canopy baseline, and a heat map, draw on optical, thermal, and elevation data from different operators, and benefit from a single access point like Sfera Technologies rather than managing several vendor relationships. For the full ranked view of the optical market, see our high-resolution satellite imagery providers guide.
Frequently asked questions
Below are answers to the questions urban planning buyers most commonly ask. Each answer points to the section where the full detail lives.
How is satellite data used in urban planning?
Satellite data supports five main urban planning workflows: tracking growth and land-use change, building 3D city models and basemaps, measuring green space and canopy for regulatory reporting, mapping urban heat islands, and extracting transportation network detail. The full breakdown is in “How satellite data is used in urban planning“.
What satellite data does the Nature Restoration Regulation require for cities?
The Regulation requires member states, not individual cities, to show no net loss in green space and tree canopy by 2030, measured against a 2024 baseline calculated from Copernicus Land Monitoring Service data. Anyone verifying that baseline today needs a dated image record reaching back to 2024, since the archive matters more than resolution here. More detail is in “How satellite data is used in urban planning“.
Can satellites measure urban tree canopy and green space?
Multispectral optical imagery measures vegetation cover through indices like NDVI, and the Copernicus Land Monitoring Service’s Tree Cover Density dataset is the specific product EU law ties to canopy measurement. Commercial thermal and land-cover analytics add finer detail for a single city rather than for a whole member state. The method is described in “How satellite data is used in urban planning“.
What resolution do I need for urban planning?
Citywide growth and land-use monitoring works at 10 to 30 meters, the resolution the open Sentinel-2 and Landsat archives deliver. Building footprints, road networks, and zoning detail need 30 centimeters to 1 meter, while elevation modeling for shadow or drainage studies sits in between, at a few meters. The full task-to-resolution mapping is in “What satellite data you need for urban planning“.
Which satellite data providers are best for urban planning?
Vantor and Nearmap lead on citywide basemap refresh, Ecopia AI supplies building footprint and transportation vector layers, and Sentinel Hub is the cheapest route into the archive depth that Nature Restoration Regulation reporting needs. Airbus covers one-off VHR tasking and elevation modeling for a specific site. Provider details and access models are in “Satellite data providers for urban planning“.
Can satellite imagery show who lives in a neighborhood or how buildings are used?
No. A satellite resolves rooftops and tree canopy, not population, tenancy, or social infrastructure behind a facade, so that information still comes from administrative and census data. Street-level detail has the same limit in the other direction, since aerial survey and mobile mapping beat any satellite image for curb-level work. The full picture is in “How to choose satellite data for urban planning“.

My passions are Earth Observation and Satellites, and my profession is Data Analysis. I combine both within ObservationData.com to show you the use cases of Earth Observation, to help you find the right provider, and to share your experiences.
