
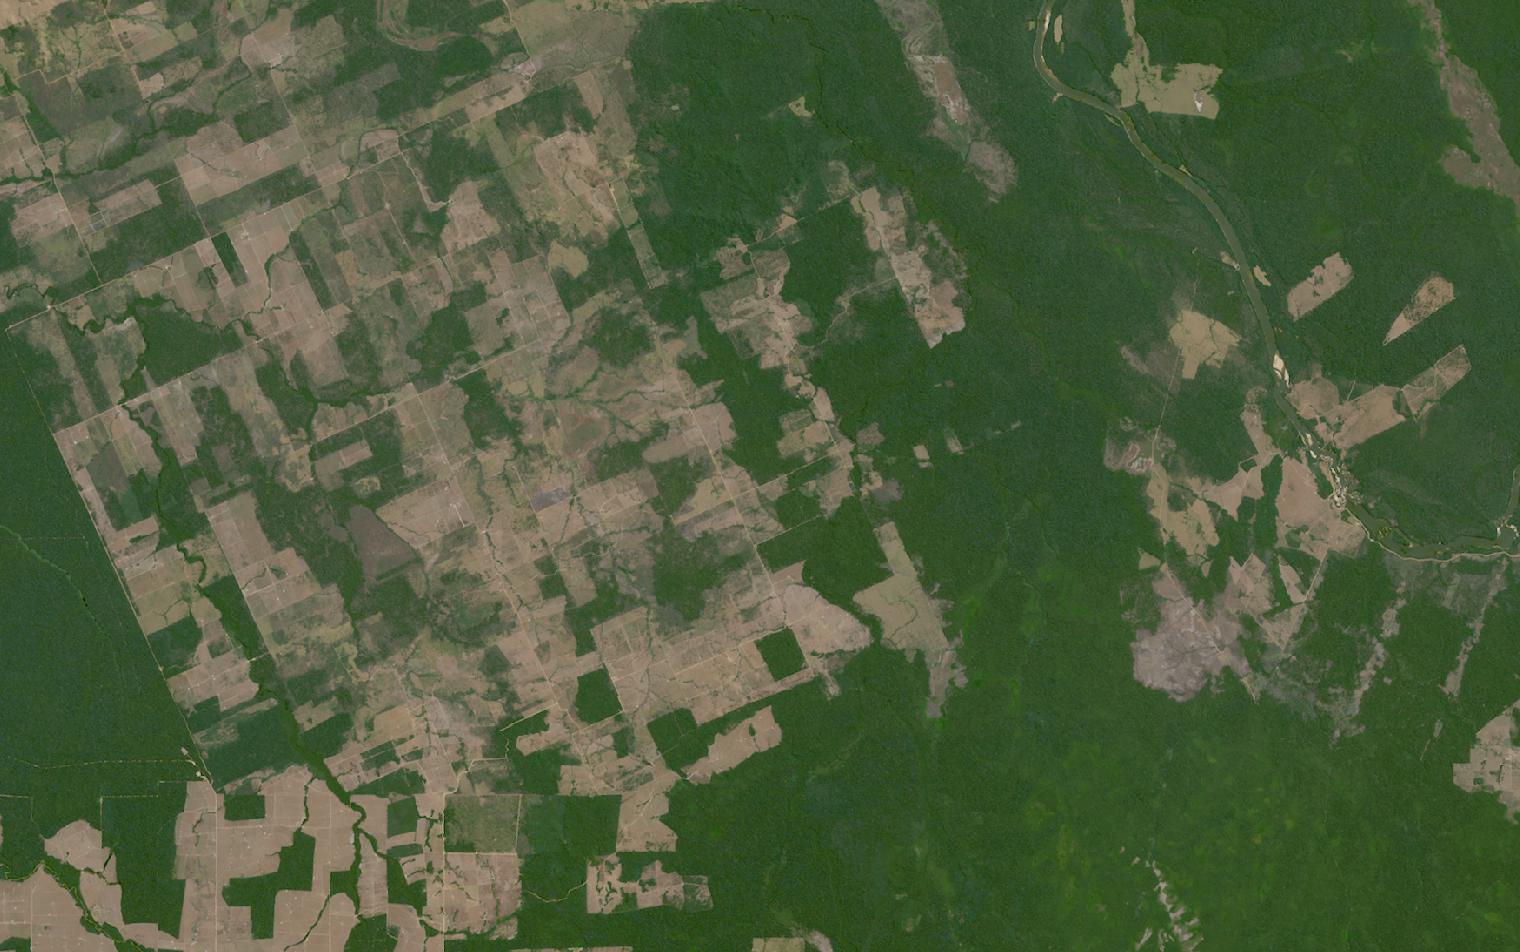
Canopy change runs across terrain that is remote, roadless and legally contested, well beyond what crews can survey.
Satellite imagery measures the same forest every few days, making clearing and degradation measurable.
This guide matches forestry tasks to the right data and provider, from deforestation alerts to carbon.
Table of Contents
Key takeaways
- Forestry programs depend on long, unbroken time series that no ground survey can reproduce across a concession
- Deforestation alerting runs on 10 m optical, but proving compliance also needs dated plot polygons and a cloud-free record
- The shortlist narrows fast once you know whether you need carbon-grade biomass or an alert feed on canopy loss
Before any provider enters the picture, a forestry program has to settle what it needs from the data itself. The summary below sets out the sensors, resolution, and cadence that operational forest monitoring depends on.
| Primary sensors | Multispectral optical, SAR, thermal infrared |
|---|---|
| Working resolution | 10-30 m routine, 1.5 m detailed |
| Typical revisit | Five days with Sentinel-2 |
| Core indices | NDVI, NBR, aboveground biomass |
| Entry cost | Free with Sentinel-2, or from $28 per month |
| Main constraint | Tropical cloud cover hides fresh clearings |
Those figures cover the baseline that most monitoring programs run on. Programs that depart from it, through carbon accounting, regulatory evidence, or stand-level inventory, change both the sensor mix and the cost.
How satellite data is used in forestry
Satellite data enters forestry programs at six distinct workflow stages, each relying on different sensor types and delivering different forms of decision support to forest managers, compliance officers, and carbon project developers.
Deforestation and illegal logging detection
The most widespread forestry application is alerting on canopy loss. A change-detection model compares each new optical acquisition against a rolling baseline and flags pixels where reflectance shifts from a forest signature to bare soil or regrowth. At 10 m resolution with a five-day revisit, Sentinel-2 catches clearings well below one hectare, which is the scale at which most illegal logging actually operates.
Satelligence builds its deforestation alerts on exactly this stack, using Sentinel-2 as the workhorse, Landsat for the historical time series, and Sentinel-1 radar to keep the record continuous when clouds close in. Detection accuracy is geography-dependent rather than a single headline number, and any vendor claim in that area is worth checking against results from your own region.
A limitation runs through the whole category. EOS Data Analytics documents it plainly for its Forest Monitoring platform, which interprets any loss of forest cover as deforestation, including planned logging operations and natural change. Distinguishing a licensed harvest from an illegal one is a question the imagery cannot answer on its own, and every alerting workflow needs a permit layer beside it.
Proving deforestation-free supply chains under the EUDR
The EU Deforestation Regulation, Regulation (EU) 2023/1115, turns forest monitoring from a sustainability initiative into a customs requirement. Anyone placing cattle, cocoa, coffee, oil palm, rubber, soy, or wood on the EU market must show the goods are deforestation-free, which the regulation defines as produced on land not subject to deforestation after 31 December 2020. For wood there is a second test: it must have been harvested without inducing forest degradation after that same date.
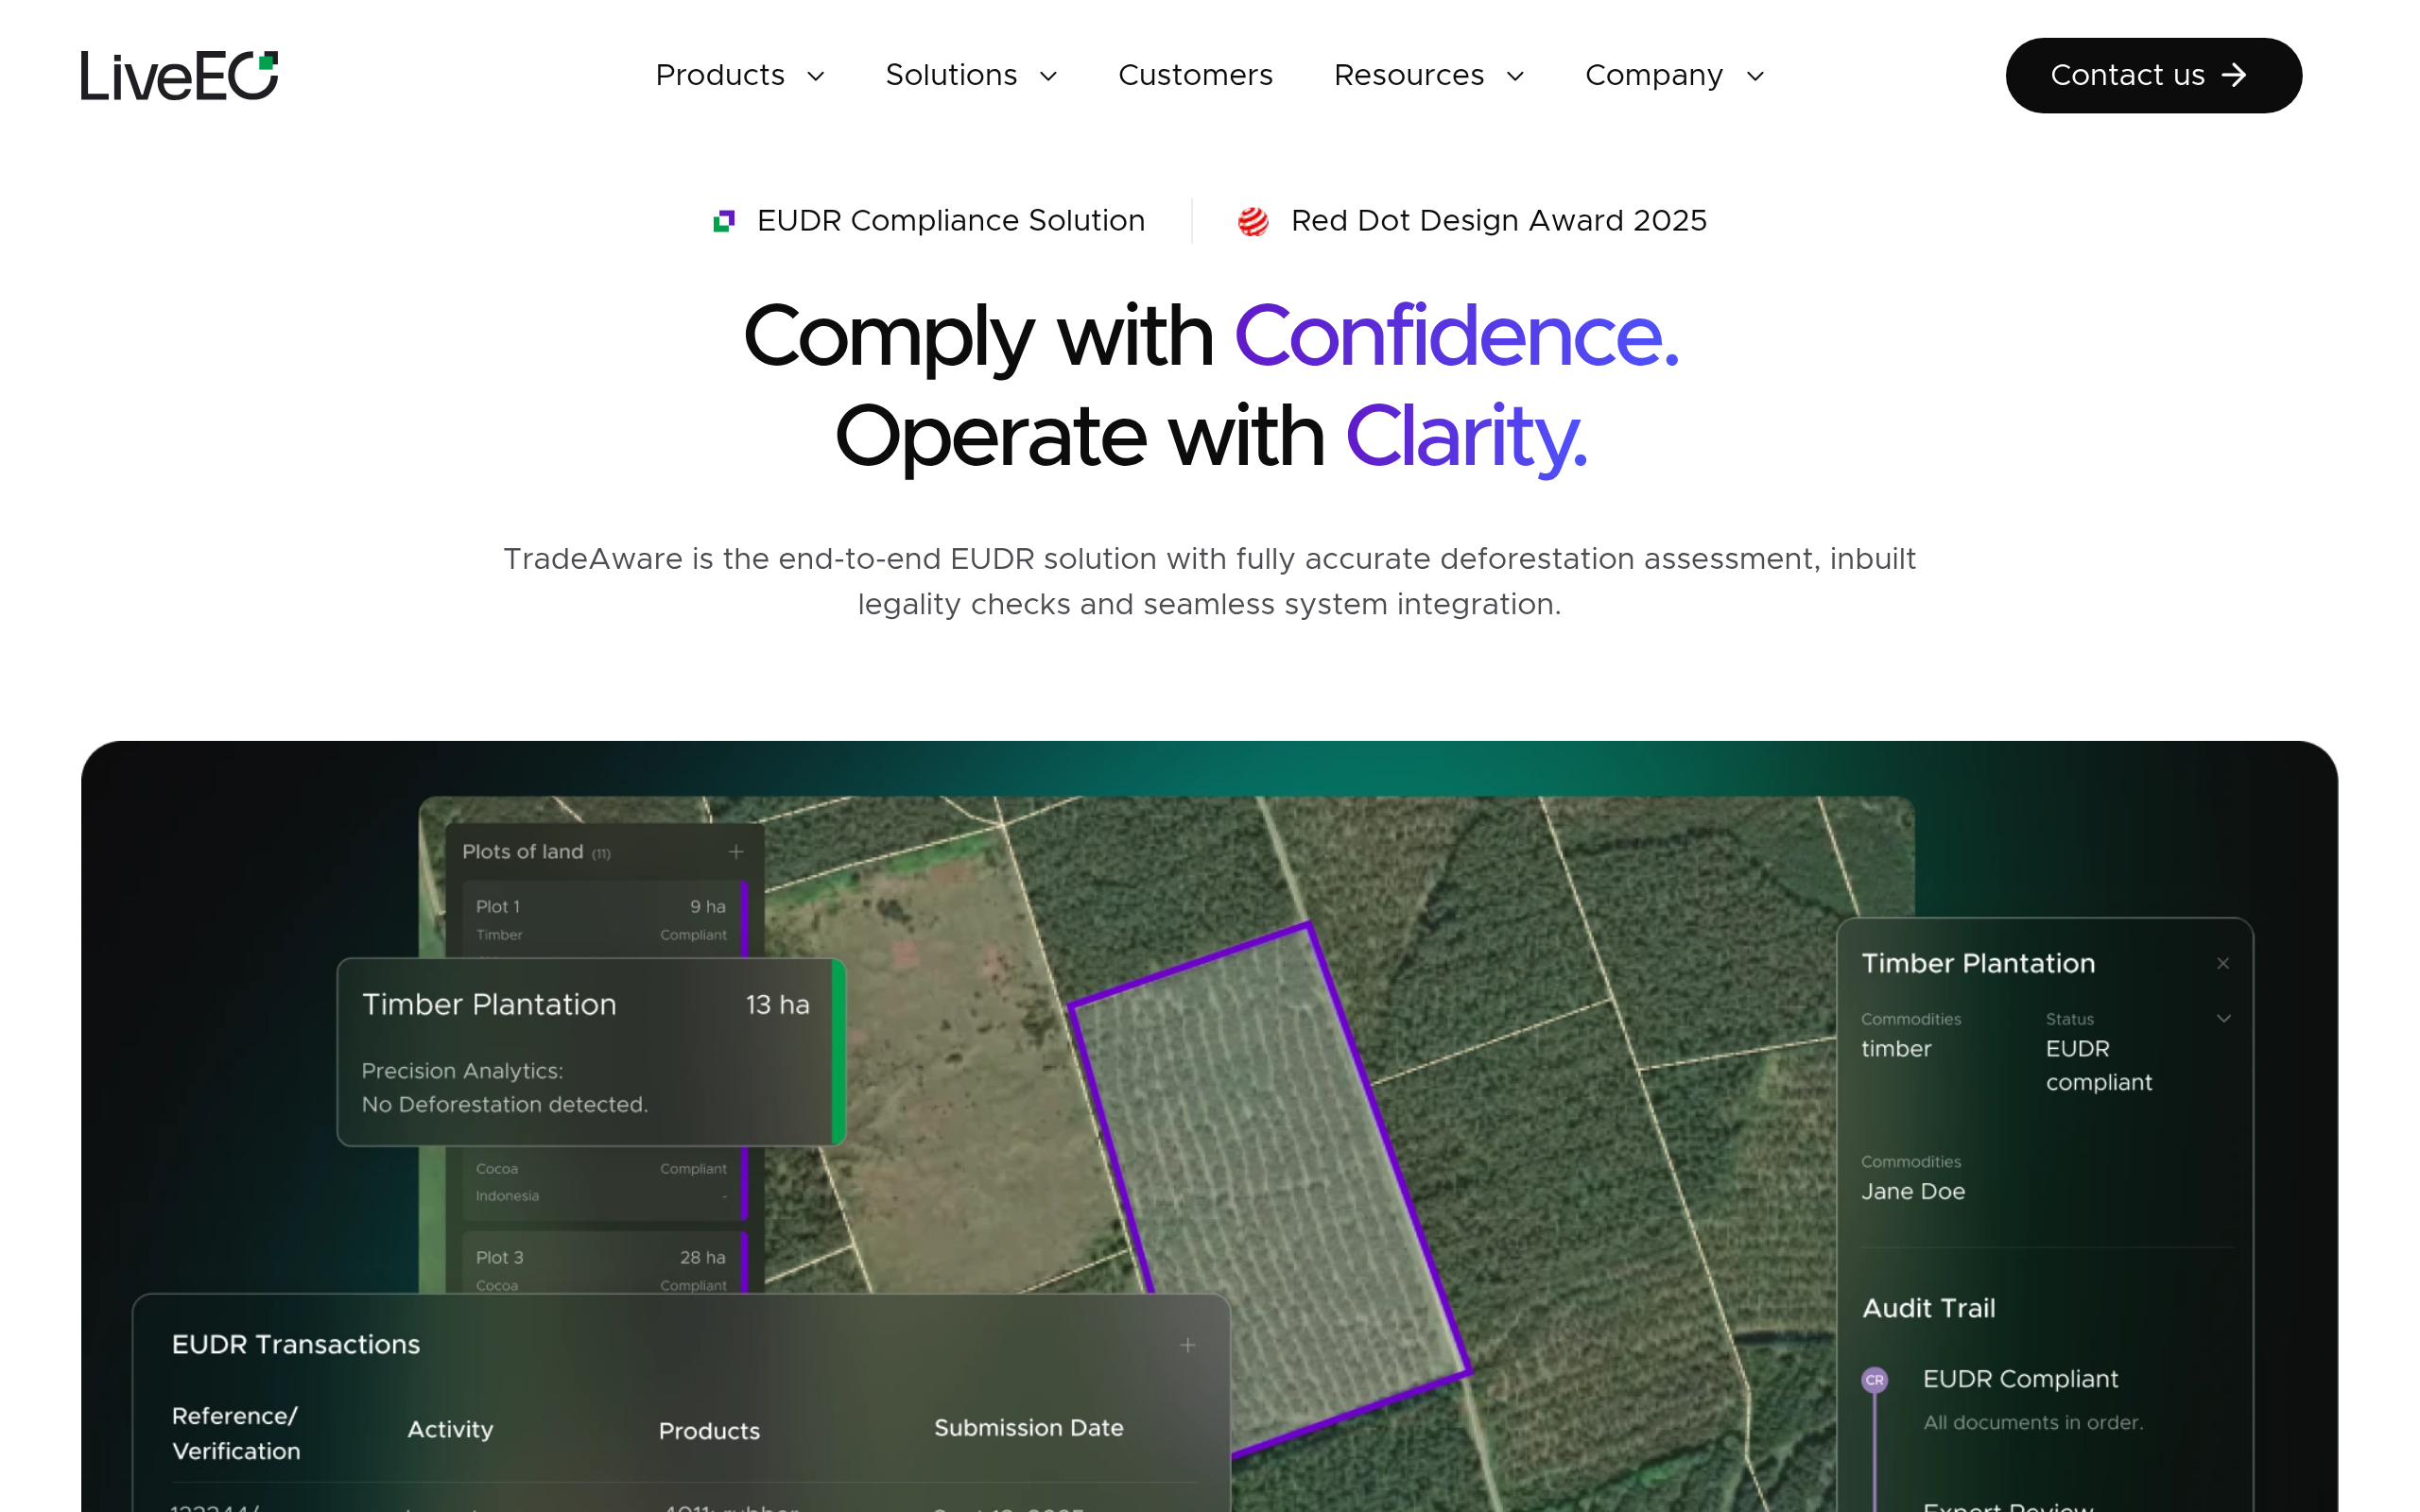
What makes this a satellite problem is Article 9, which requires the due diligence statement to carry the geolocation of every plot of land where the commodity was produced, together with the date or time range of production. Article 2 sets the precision: latitude and longitude to at least six decimal digits, and for plots larger than four hectares of any commodity other than cattle, the location must be given as a polygon rather than a point.
Those two thresholds are where imagery becomes unavoidable. A four-hectare polygon has to be drawn against something, and it has to be checked against canopy cover on a date five years in the past.
Reading the two articles side by side, what strikes me is that the archive matters more than the sensor. The plot boundary can come from almost any current 10 m source, but the December 2020 baseline can only come from data somebody already collected, which quietly rules out any provider whose record starts later.
LiveEO’s TradeAware product is built around that workflow, from supplier onboarding through deforestation analytics to submission of the statement, and Satelligence approaches the same obligation from the commodity-sourcing side. Obligations apply to large and medium operators from 30 December 2026, with micro and small enterprises following on 30 June 2027 after the postponement agreed in Regulation (EU) 2025/2650.
Aboveground biomass and forest carbon
Carbon programs need a number, not a map of change. Aboveground biomass estimates convert canopy structure into tonnes of carbon per hectare, and the credibility of a REDD+ or restoration project rests on how that number was derived and how far back the baseline runs. Optical imagery alone cannot see structure, so biomass products fuse it with spaceborne and airborne LiDAR that measures canopy height directly.
Chloris Geospatial publishes annual biomass stock and biomass change maps from the year 2000 onwards at 30 m, with 10 m products available, which gives a project a 25-year record rather than a baseline invented at project start.
Sylvera’s Biomass Atlas covers the same ground at 30 m with canopy height alongside biomass, and reports errors below 9 percent at project scale. Both are analytics companies rather than satellite operators, which is the norm in this segment: the value sits in the model and the calibration data, not the pixels.
Forest inventory and species composition
Stand-level inventory asks a different question again. A forest manager planning a rotation needs stem counts, crown delineation, and species mix, and none of that survives at 10 m. Very high resolution optical imagery at 0.3 to 1.5 m resolves individual crowns, and Airbus supplies SPOT 6 and SPOT 7 imagery at 1.5 m with a 60 km swath, wide enough to cover a full concession in a single pass.
Species discrimination is a spectral problem rather than a spatial one. Broadleaf and conifer separate reasonably in a standard multispectral band set, but distinguishing species within a genus needs narrow contiguous bands. Hyperspectral sensors deliver dozens of them, and Sfera Technologies brokers hyperspectral imagery at 5.3 m with 31 spectral bands, aimed at plant species differentiation rather than general land cover.
Wildfire detection and burn scar mapping
Fire monitoring splits cleanly into two jobs on two sensor types. Detection is thermal: an active fire radiates strongly in the mid-infrared, and thermal instruments find hotspots sub-daily across whole continents, which is why fire alerting is one of the few forestry applications where latency matters more than resolution. OroraTech operates a constellation of thermal infrared cubesats built specifically for wildfire detection, and runs national early warning systems on it.
Assessing what burned is optical. The Normalized Burn Ratio contrasts near-infrared against shortwave infrared, and differencing it before and after a fire yields dNBR, the standard measure of burn severity. At Sentinel-2’s 10 m resolution the resulting severity map is detailed enough to plan salvage and replanting stand by stand.
Storm, pest, and drought damage
Windthrow after a storm, bark beetle outbreaks, and drought-driven crown dieback all appear as anomalies against a forest’s own seasonal trajectory rather than as clean canopy loss.
Multispectral time series at 3 to 10 m catch the divergence, and moisture-sensitive indices in the shortwave infrared often register stress before the canopy visibly thins. Rezatec refreshes its forest disturbance products every 5 to 12 days on Sentinel-2 and Landsat, which is the cadence at which a beetle outbreak can still be contained.
What satellite data you need for forestry
Different forestry tasks require different sensor modalities, resolutions, and revisit frequencies. The table below maps each common task to the data specifications it requires.
| Task | Sensor modality | Resolution | Revisit | Key index / band |
|---|---|---|---|---|
| Deforestation alerting | Multispectral optical | 10 m | Five days | NDVI change, canopy loss |
| Cloud-persistent monitoring | SAR (C-band) | 10-20 m | 6-12 days | Backscatter change |
| EUDR plot compliance | High-resolution optical | 0.5-3 m | Annual, dated | Canopy cover, plot polygon |
| Aboveground biomass | Optical and LiDAR fusion | 10-30 m | Annual | AGB, canopy height |
| Canopy height mapping | Spaceborne LiDAR and stereo optical | 30 m | Annual | Canopy height model |
| Species composition | Hyperspectral | 5-30 m | Per season | Narrowband reflectance |
| Stand inventory | Very high resolution optical | 0.3-1.5 m | Per rotation | Crown delineation |
| Active fire detection | Thermal infrared | 375 m | Sub-daily | Brightness temperature, FRP |
| Burn severity mapping | Multispectral optical (NIR + SWIR) | 10-30 m | Post-event | NBR, dNBR |
| Storm and pest damage | Multispectral optical | 3-10 m | 5-12 days | NDVI anomaly, NDMI |
With data requirements mapped, the next step is identifying which providers can supply them. The section below covers the most relevant options for forestry programs, from compliance SaaS to raw imagery operators.
Satellite data providers for forestry
The providers below have documented forestry use cases and data products that map to the tasks in the table above. The mix spans satellite operators, analytics platforms, and multi-source access points.
| Provider | Type | Best for | Key forestry spec | Entry point |
|---|---|---|---|---|
| Planet | Satellite operator | Near-daily canopy monitoring | Forest Carbon Diligence at 30 m | Imagery from $2,700 per year |
| LiveEO | Analytics platform | EUDR compliance filing | Plot-level deforestation analytics | Enterprise contract |
| Satelligence | Analytics platform | Commodity supply chain alerts | Sentinel-1 and Sentinel-2 fusion | Demo request |
| Chloris Geospatial | Analytics platform | Carbon-grade biomass change | Annual biomass at 10 m and 30 m | From $5,000 per year |
| Airbus | Satellite operator | Concession-scale inventory | SPOT 6 and SPOT 7 at 1.5 m | Quote or UP42 marketplace |
| Sentinel Hub | Data platform | Open archive at scale | Sentinel-2 at 10 m | From $28 per month |
| Sfera Technologies | Multi-source access point | Several sensor types in one contract | Optical, SAR, hyperspectral | From $4 per km² optical |
For a ranked shortlist of providers by imagery type, our guide to the best satellite imagery providers covers the full market with head-to-head specifications. Forestry programs working in the tropics should also review the best SAR data providers, whose all-weather coverage is the only reliable answer to a permanent cloud deck.
How to choose satellite data for forestry
The first decision is what the data has to prove. An operational alert feed and a carbon-grade biomass baseline are different products built from different inputs, and a vendor strong at one is rarely the cheapest route to the other. Deforestation alerting is a change-detection service on open imagery. Biomass is a modeling exercise that lives or dies on calibration data, which is why Chloris and Sylvera sell models rather than pixels.
Regulatory exposure sets the second cut. If EUDR obligations apply to your supply chain, the deliverable is not a map but a due diligence statement carrying plot polygons and production dates, filed into the EU information system. That is a compliance workflow, and LiveEO and Satelligence build for it. A general imagery subscription leaves you assembling the evidence chain yourself.
Geography decides the sensor mix. Optical monitoring works well in temperate and boreal forests where clear days are common, but in the humid tropics a fresh clearing can stay hidden under cloud for months. Programs in Indonesia, the Congo Basin, or the Amazon should treat SAR as core rather than as a complement, either through a platform aggregator carrying the Sentinel-1 archive or through a direct radar operator with tasking.
Budget and area follow from the cadence you actually need. Continuous monitoring of a large concession is cheaper on an area subscription than on per-scene ordering, while a one-off inventory or a due diligence campaign on a defined set of plots is the case for per-square-kilometre archive access without an annual commitment.
Data rights are material for compliance and carbon work in a way they are not elsewhere: verify whether your intended use, including regulatory submissions, third-party audit, and public disclosure of derived maps, is permitted under the provider’s standard commercial license before committing.
Verdict
Forestry is the vertical where satellite data has the longest record and the clearest legal pull. Deforestation detection on 10 m open imagery is a solved commodity, available free through Sentinel-2 and packaged by several analytics vendors. What separates programs is what they must prove and to whom.
Teams facing EUDR obligations before 30 December 2026 should evaluate LiveEO and Satelligence first, because the deliverable is a filed statement rather than a map. Carbon project developers need a defensible biomass baseline, and Chloris and Sylvera both reach back to the year 2000 at 30 m, which no imagery subscription reconstructs on its own. Forest managers running inventory and harvest planning need very high resolution optical from Airbus or Planet, and hyperspectral if species mix drives the decision.
Programs that span all three, an alert feed, a compliance archive, and periodic high-resolution inventory, draw on optical, SAR, and hyperspectral data from different operators, and benefit from a single access point rather than managing three separate commercial relationships and data pipelines. For a full ranked view of the imagery market, see our satellite imagery providers guide. For hyperspectral species work, the hyperspectral imagery providers ranking covers the current commercial options.
Frequently asked questions
Below are answers to the questions forestry buyers most commonly ask. Each answer points to the section where the full detail lives.
How is satellite imagery used in forestry?
Satellite imagery covers six main workflows: deforestation and illegal logging alerts, evidence for deforestation-free supply chains, aboveground biomass and carbon measurement, stand inventory and species mapping, wildfire detection and burn severity, and storm, pest, and drought damage assessment. The detail is in “How satellite data is used in forestry“.
What satellite data does EUDR compliance require?
The regulation requires the geolocation of every plot where the commodity was produced, given to at least six decimal digits, and as a polygon for plots larger than four hectares of any commodity other than cattle. Those plots must be shown free of deforestation after 31 December 2020, which means a dated canopy record reaching back at least to that year. The obligation is covered in “How satellite data is used in forestry“.
Can satellites measure forest carbon?
Satellites measure canopy structure and reflectance, from which aboveground biomass is modeled rather than observed directly. Credible products fuse optical time series with LiDAR canopy height and calibrate against field plots, and the leading commercial layers report annual biomass at 30 m back to the year 2000. Accuracy is stated at project scale, not per pixel. The approach is described in “How satellite data is used in forestry“.
What resolution do I need for forest monitoring?
Routine deforestation alerting and biomass monitoring work at 10 to 30 m, which is what the open Sentinel-2 and Landsat archives deliver. Stand inventory, crown delineation, and plot boundary drawing need 0.3 to 1.5 m, and active fire detection works at 375 m because latency matters more than detail. The full task-to-resolution mapping is in “What satellite data you need for forestry“.
Which satellite data providers are best for forestry?
LiveEO and Satelligence are the strongest options for EUDR compliance and commodity supply chain alerting. Chloris Geospatial and Sylvera lead on carbon-grade biomass with baselines back to 2000, Airbus supplies the very high resolution optical that stand inventory needs, and Sentinel Hub is the cheapest route into the open archives. Provider details and access models are in “Satellite data providers for forestry“.
How do satellites monitor forests through cloud cover?
Radar penetrates cloud and works at night, so Sentinel-1 and commercial SAR constellations keep a monitoring record continuous in the humid tropics where optical sensors may be blocked for months. The trade-off is interpretation: backscatter change signals structural disturbance but does not read as an image a forester can inspect. Sensor choice by geography is discussed in “How to choose satellite data for forestry“.

My passions are Earth Observation and Satellites, and my profession is Data Analysis. I combine both within ObservationData.com to show you the use cases of Earth Observation, to help you find the right provider, and to share your experiences.
