
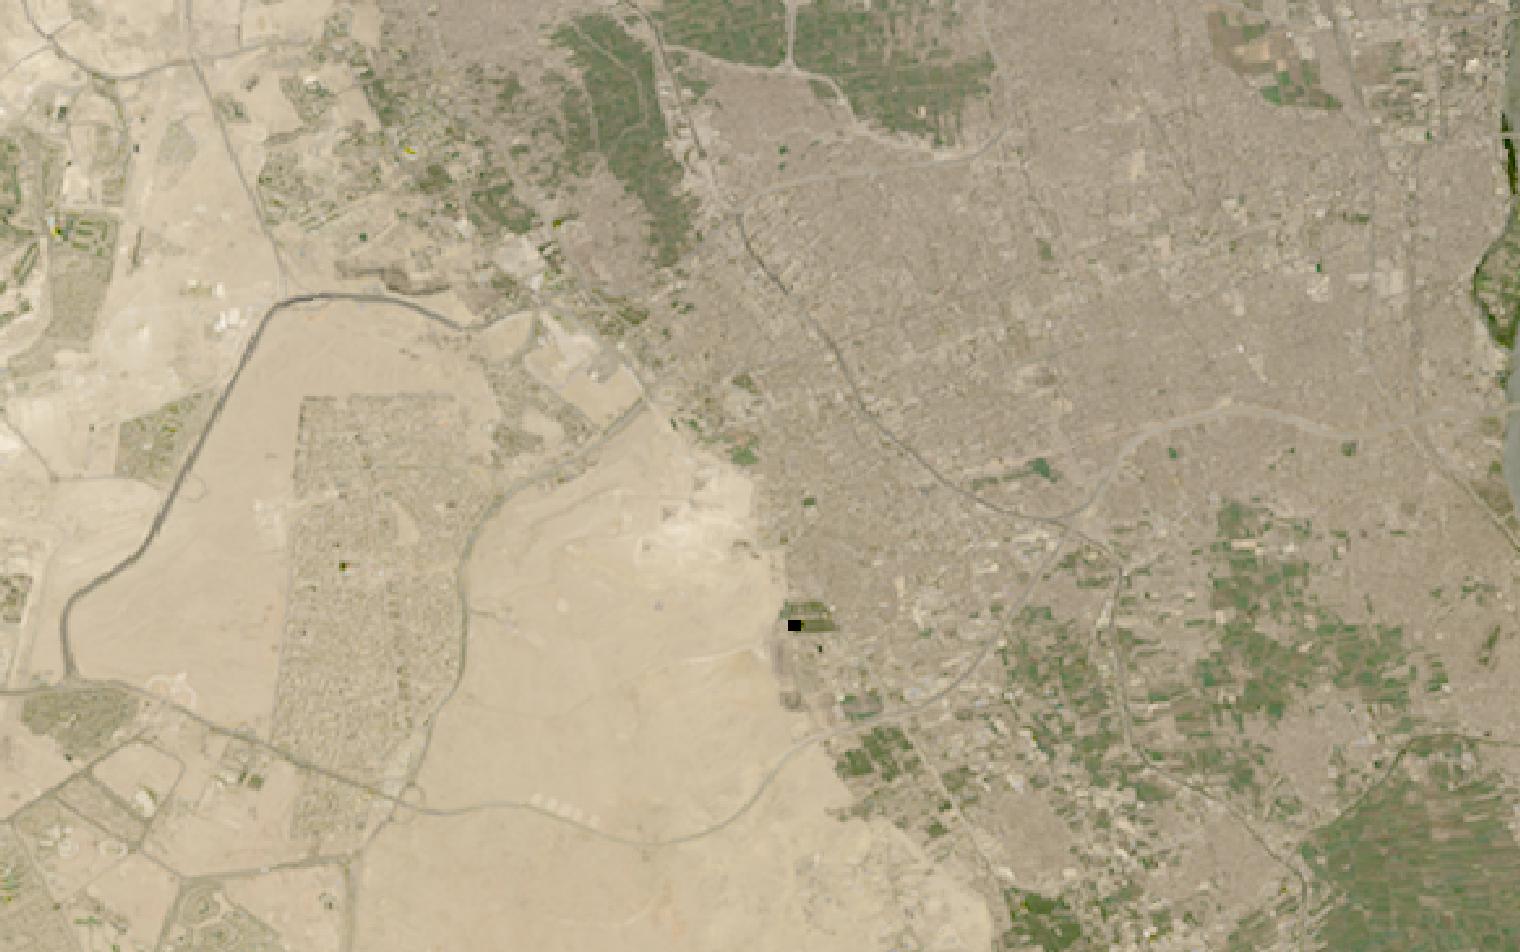
Survey areas run to thousands of square kilometres, where walking every field is not realistic.
Satellite data observes the same ground repeatedly, turning a hunch into a testable, mappable pattern.
This guide matches archaeology survey tasks to the right data and provider.
Table of Contents
Key takeaways
- Archaeology depends on anomaly detection across landscapes too large to walk, not on satellites finding sites outright
- Prospection favors resolution and archive depth, while looting monitoring needs frequent, repeatable revisit
- The shortlist narrows fast once you know whether the task is site discovery or ongoing condition monitoring
Before any provider enters the picture, a survey or monitoring program has to settle what it needs from the data itself. The summary below sets out the sensors, resolution, and cadence that archaeological work depends on.
| Primary sensors | VHR optical, hyperspectral, SAR |
|---|---|
| Working resolution | 0.3-0.5 m for prospection, 10-30 m routine |
| Typical revisit | Near-daily with PlanetScope |
| Core indices | NDVI, soil moisture, elevation change |
| Entry cost | Free with Sentinel-2, or from $28 per month |
| Main constraint | Marks show only under narrow conditions |
Those figures cover the baseline that most desk-based screening runs on. Work that departs from it, through elevation surveys, hyperspectral analysis, or all-weather SAR, changes both the sensor mix and the cost.
How satellite data is used in archaeology
Satellite data enters archaeology at five distinct points in the workflow, each relying on different sensor types and delivering different forms of evidence to survey teams, heritage officers, and site managers.
Prospection and finding buried structures
Site prospection starts with very high-resolution optical imagery, since buried walls, mounds, and hollow ways often leave a faint shadow or soil-tone anomaly visible only at fine resolution. Airbus’s Pléiades Neo reaches 30 cm, and Vantor’s WorldView Legion reaches 34 cm, both fine enough to catch a subtle rise or depression in arid and semi-arid terrain.
None of this finds a site on its own. A satellite flags an anomaly, and ground teams still have to check whether it is real.
Growth and soil marks that hint at a buried wall show up only under a narrow combination of moisture, season, and sun angle. A 30 cm pixel does not resolve the top of a wall, and a shape that reads as a floor plan from orbit is often nothing more than a farm track.
Excavation, geophysical survey on the ground, and archival research remain the actual proof, with imagery narrowing down where to look first. For landscapes with a long settlement history, declassified Cold War imagery often beats a brand-new scene: CORONA frames, captured by US reconnaissance satellites and declassified in 1995, are public domain and free through the US Geological Survey, showing terrain before modern roads, irrigation, and urban growth covered it over.
Growth marks and soil marks over buried features
Buried walls, ditches, and foundations change how much moisture and nutrients the soil above them holds, and that difference shows up in how crops or grass grow above it. A buried ditch often retains more water and produces taller, greener growth, while a buried wall starves the soil above it and shows as a paler, stunted line.
Spectral discrimination is what actually separates a real mark from background noise, since narrow, contiguous bands catch subtle reflectance shifts that a standard four-band camera misses. Wyvern’s Dragonette satellites deliver 31 bands across the visible and near-infrared at 5.3 m resolution, a spectral range built for exactly this kind of vegetation and soil differentiation.
Timing matters more than resolution here, because marks appear for days, not months, right after a dry spell or early in a growing season. Planet’s PlanetScope revisits near-daily, which raises the odds of catching that narrow window, while Sentinel Hub gives free access to the Sentinel-2 archive for teams screening larger areas at 10 m before committing to a tasked, finer-resolution pass.
Damage and looting monitoring at known sites
Once a site is documented, the job shifts from discovery to watching it over time. Looting pits, construction encroachment, and conflict damage all show up as new disturbance against a known baseline, and Planet’s PlanetScope constellation revisits the same ground near-daily, fast enough to flag a fresh pit within days rather than at the next scheduled survey.
Cloud cover and smoke do not stop the assessment either. Capella Space operates X-band SAR down to 0.25 m in Spotlight Ultra mode, all-weather and day-or-night, and when a report needs verifying fast, Vantor’s Direct Access program delivers imagery as fast as 15 minutes after collection, turning a suspected incident into a confirmed one before the trail goes cold.
None of this belongs in a public report at site-level precision. Publishing exact coordinates alongside a looting alert hands the same map to looters, so heritage teams fuzz or aggregate locations before anything leaves a restricted database.
Ground movement and erosion at monuments
Standing monuments face a slower threat than looting: foundations settle, slopes erode, and walls lean over years rather than days, and the change is often too gradual for a site visit to catch reliably.
Airbus’s Elevation service generates on-demand DSM and DTM models directly from Pléiades Neo stereo pairs, letting a conservation team repeat the same monument footprint to track subsidence or slope movement between visits.
Where the movement is measured in millimeters rather than centimeters, interferometric SAR is the tool built for it. Capella Space launched a taskable InSAR service with a 3-day repeat cadence, comparing radar phase between passes to catch deformation long before it is visible to the eye.
Mapping before construction projects
Roads, pipelines, and new developments cross landscapes that may hold undocumented sites, and a desk-based check against existing imagery is far cheaper than finding out mid-excavation.
Sentinel Hub gives free access to the Sentinel-2 archive and, through the same API, to Landsat imagery reaching back to 1972, letting a planning team compare a project footprint against the landscape decades before the current infrastructure existed.
Where the desk review flags something worth a closer look, the same archive route that supports prospection applies again: a tasked or archived VHR pass from Airbus or Vantor resolves the feature well enough to decide whether ground teams need to walk the corridor before construction begins. The land-cover baselines that reveal a site’s setting are covered in our guide to satellite data for conservation.
What satellite data you need for archaeology
Different archaeology tasks require different sensor modalities, resolutions, and revisit frequencies. The table below maps each common task to the data specifications it requires.
| Task | Sensor modality | Resolution | Revisit | Key index / band |
|---|---|---|---|---|
| Site prospection, open terrain | VHR optical | 0.3-0.5 m | On demand | Shadow and soil-tone anomaly |
| Historical baseline comparison | Declassified panchromatic archive | 0.6-2 m | Historical archive | Pre-disturbance land surface |
| Growth mark detection | Multispectral optical | 3-10 m | Weekly in season | NDVI anomaly |
| Soil mark and buried-feature analysis | Hyperspectral | 5-30 m | Per season | Narrowband reflectance |
| Looting and encroachment monitoring | VHR optical | 0.5-3 m | Near-daily | Change detection |
| All-weather damage assessment | SAR | 0.25-1 m | Sub-daily | Backscatter change |
| Ground deformation at monuments | Interferometric SAR | 1-3 m | 3-12 day repeat | Millimeter displacement |
| Site elevation and microtopography | Stereo optical DSM/DTM | 0.5-5 m | On demand | Elevation model |
| Pre-construction desk screening | Open-archive optical | 10-30 m | Historical, free | Land cover context |
| Regional landscape context | Medium-resolution optical | 10-30 m | 5-16 days | Land use change |
With data requirements mapped, the next step is identifying which providers can supply them. The section below covers the most relevant options for archaeology, from VHR archive operators to a hyperspectral specialist.
Satellite data providers for archaeology
The providers below have documented archaeology and heritage-monitoring applications that map to the tasks in the table above. The mix spans VHR optical and SAR operators, a hyperspectral specialist, and an open-data access platform.
| Provider | Type | Best for | Key archaeology spec | Entry point |
|---|---|---|---|---|
| Airbus | Satellite operator | Stereo elevation at heritage sites | Elevation 0.5 DSM/DTM on demand | Quote or UP42 marketplace |
| Vantor | Optical satellite operator | Rapid-tasking site verification | 15-min Direct Access delivery | Quote or UP42 marketplace |
| Planet | Satellite operator | Near-daily looting monitoring | PlanetScope 3-3.7 m, near-daily | Imagery from $2,700 per year |
| Capella Space | SAR satellite operator | All-weather damage assessment | 0.25 m Spotlight Ultra SAR | Quote or UP42 marketplace |
| Sentinel Hub | Data platform | Free historical baseline archive | Landsat archive back to 1972 | From $28 per month |
| Wyvern | Hyperspectral satellite operator | Crop-mark spectral detection | 31 bands VNIR at 5.3 m | Quote-based |
For a ranked shortlist of options across the wider optical market, our guide to the best high-resolution satellite imagery providers covers the full field with head-to-head specifications.
How to choose satellite data for archaeology
The trap I would flag first is resolution envy. Buried features show up through crop and soil marks, not through sharp edges, so the season and the soil moisture at capture decide more than the pixel size, and a well-timed 10 m scene often beats an expensive 30 cm one that was taken in the wrong month.
The first decision is what stage of work you are in. Prospection in open, arid terrain rewards resolution and archive depth, while a known site that needs watching rewards revisit frequency and rapid tasking instead. Buying VHR imagery for a monitoring problem, or a monitoring subscription for a discovery problem, wastes budget on the wrong axis.
Terrain sets the second cut. Optical and SAR both work well over open ground, desert, and grassland, but neither sees through dense forest canopy: a closed canopy blocks optical entirely and dominates SAR return with leaf scatter rather than ground signal. Programs in tropical, heavily forested regions are better served by airborne LiDAR than by any satellite product in this guide.
Budget follows from how the data will be used. A one-off desk screening or a single historical comparison is well served by free or low-cost archive access such as Sentinel Hub, while an ongoing monitoring program covering dozens of sites justifies a subscription or a dedicated tasking contract.
Licensing terms matter more here than in most verticals, since a heritage program often needs to share derived maps with a ministry, a university partner, or the public. Confirm before committing that your intended redistribution is covered under the provider’s standard license, and keep precise site coordinates out of anything that leaves a restricted, internal system.
Verdict
Archaeology is a vertical where satellite data narrows a search rather than closes a case. The evidence bar stays with the ground: excavation, geophysics, and archival research remain what actually confirms a discovery, and no provider in this guide claims otherwise.
Teams doing open-terrain prospection get the most from Airbus and Vantor’s very high-resolution optical archives, while Wyvern’s hyperspectral bands add a genuine edge for separating a real soil mark from noise. Sentinel Hub’s free Sentinel-2 and historical Landsat access is the right starting point for any desk-based screening before a bigger commitment.
Programs watching known sites for looting or conflict damage should lean on Planet’s near-daily revisit and Capella Space’s all-weather SAR, with Vantor’s rapid tasking as the fast-turnaround option when a report needs same-day confirmation. Airbus’s on-demand elevation models and Capella’s taskable InSAR cover the slower threat of subsidence and erosion at standing monuments.
For a full ranked comparison of resolution, tasking speed, and pricing across the VHR optical market, see our best high-resolution satellite imagery providers guide.
Frequently asked questions
Below are answers to the questions archaeology teams most commonly ask about satellite data. Each answer points to the section where the full detail lives.
How is satellite imagery used in archaeology?
Satellite imagery supports five main tasks: prospection for buried structures, growth and soil mark analysis, looting and damage monitoring at known sites, ground movement tracking at monuments, and desk-based screening before construction. Ground verification follows every one of them. The detail is in “How satellite data is used in archaeology“.
Can satellites find buried ruins?
A satellite can flag an anomaly, a shadow, a soil-tone difference, or a stunted patch of vegetation that is consistent with a buried wall or ditch, but it cannot confirm one. Many features that look like a ground plan from orbit turn out to be farm tracks or modern disturbance once a team walks the ground. This reasoning is covered in “How satellite data is used in archaeology“.
What resolution do I need for archaeological survey?
Open-terrain prospection for walls and mounds needs 0.3 to 0.5 m very high-resolution optical imagery, while growth-mark and soil-mark analysis works at 3 to 30 m across multispectral and hyperspectral sensors. Looting monitoring runs on the VHR tier at a faster, near-daily cadence instead of a one-off pass. The full task-to-resolution mapping is in “What satellite data you need for archaeology“.
Which satellite data providers are best for archaeology?
Airbus and Vantor lead on very high-resolution optical for prospection and archive review, Wyvern is the dedicated hyperspectral option for soil and vegetation mark analysis, and Planet’s near-daily revisit and Capella Space’s all-weather SAR both suit ongoing site monitoring. Sentinel Hub is the free starting point for desk-based screening. Provider details and access models are in “Satellite data providers for archaeology“.
Can satellites detect looting at archaeological sites?
Yes: fresh looting pits change the surface enough to register as a clear anomaly against a documented baseline, and near-daily optical revisit or all-weather SAR both catch it quickly. What a monitoring program should never publish is the precise coordinate of the affected site, since that information can guide the next looter as easily as it warns a heritage officer. This trade-off is discussed in “How satellite data is used in archaeology“.
Do satellites find lost cities under jungle canopy?
Not on their own. Optical sensors cannot see through a closed forest canopy, and SAR mostly returns the leaf layer rather than the ground beneath it, which is why headline-grabbing forest discoveries are almost always airborne LiDAR work, not satellite imagery. Matching the sensor to the terrain, not the headline, is covered in “How to choose satellite data for archaeology“.

My passions are Earth Observation and Satellites, and my profession is Data Analysis. I combine both within ObservationData.com to show you the use cases of Earth Observation, to help you find the right provider, and to share your experiences.
