
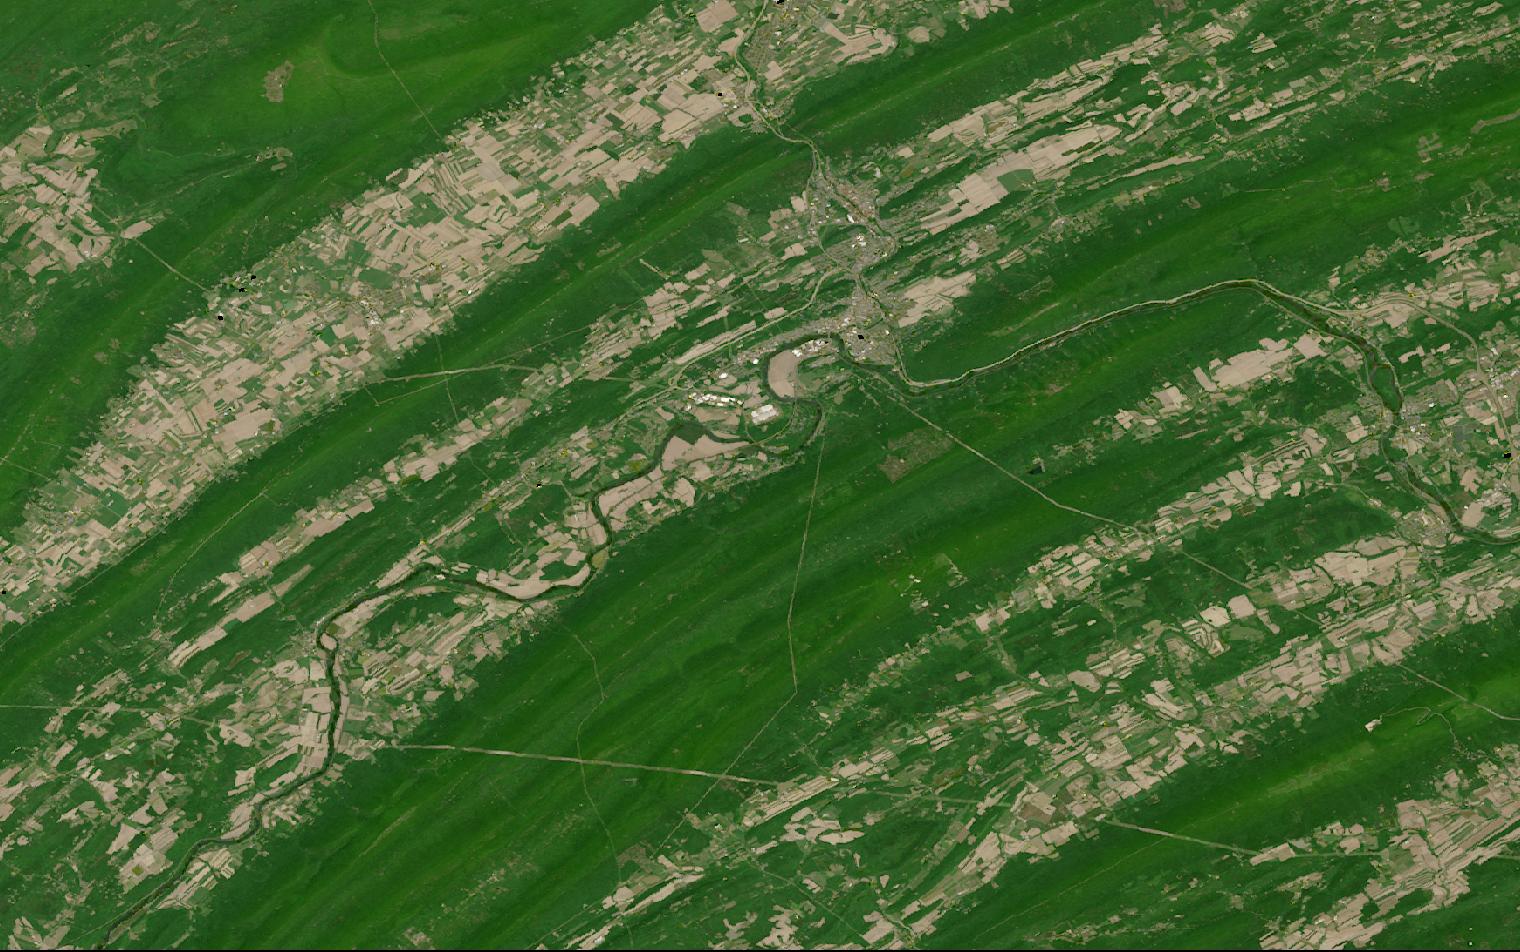
Where a signal reaches depends on terrain, buildings and vegetation that no drive test covers.
Satellite and aerial data turn the ground into a surface feeding propagation models and site plans.
This guide matches telecommunications planning tasks to the right data and provider.
Table of Contents
Key takeaways
- Telecommunications network planning leans on terrain and land cover data before a single radio survey happens
- Radio propagation models run on elevation data, but clutter classification decides how accurate the prediction is
- The provider shortlist narrows fast once you know whether you need terrain models, site imagery, or building counts
Before any provider enters the picture, a telecom program has to settle what its data actually needs to prove. The summary below sets out the sensors, resolution, and cadence that network planning depends on.
| Primary sensors | Elevation models, VHR optical, AI land cover |
|---|---|
| Working resolution | 4 cm aerial, up to 30 m elevation |
| Typical revisit | On-demand tasking, up to 3x/year aerial |
| Core indices | Clutter class, DSM/DTM, building counts |
| Entry cost | From $1 per km² (elevation data) |
| Main constraint | Terrain models miss new towers and foliage change |
Those figures cover the baseline that most planning programs run on. Programs that depart from it, through dense urban build-out, rural macro coverage, or fixed wireless access, change both the sensor mix and the cost.
How satellite data is used in telecommunications
Satellite and aerial data enter telecom planning at five distinct workflow stages, each relying on different sensor types and delivering different forms of decision support to RF engineers, site acquisition teams, and network planners.
Radio propagation modeling with terrain elevation data
Radio propagation modeling predicts signal strength across a coverage area, and the calculation starts with terrain: a digital surface model for above-ground clutter, a digital terrain model for the bare earth beneath it.
Intermap builds its NEXTWave Telecom planning software directly on this pair, drawing on the company’s own NEXTMap elevation archive, offered for telecom work at 1-meter and 6-meter resolution, collected by an airborne radar instrument that reads ground detail through cloud cover optical sensors cannot penetrate.

Vantor answers the same requirement from a different resolution tier. Its Vivid Terrain product, marketed to network planners as the Vivid Terrain Telco Suite, derives a 50-centimeter surface model accurate to within 3 meters in all dimensions, covering more than 100 million square kilometers across the areas operators care about most.
A terrain model does not predict radio behavior by itself. It supplies the geometry a propagation model consumes, and how well that prediction holds against a live network depends on the model and the drive-test data behind it, not on how many centimeters a pixel spans.
Those models are standardised rather than proprietary. Recommendation ITU-R P.1812, in force as P.1812-8 since September 2025, sets out the path-specific prediction method for point-to-area terrestrial services from 30 MHz to 6 GHz, and it is the model the elevation and clutter data on this page feed.
Currency is the other limit. A digital surface model built in 2023 has no record of a tower raised in 2025, and a stand of deciduous trees attenuates a signal differently between summer leaf-out and bare winter branches, a change no elevation dataset registers.
Clutter and land cover classification for RF planning
A propagation model treats a forest, a parking lot, and a row of townhouses as different attenuation values, and that distinction is called a clutter class. Ecopia AI’s 3D Land Cover product turns imagery into classified planimetric features, among them buildings, roads, driveways, water, and tree canopy, extracted by AI from partner imagery rather than digitized by hand.
For a first pass in Europe there is a free alternative at a coarser grain. Copernicus CORINE Land Cover carries 44 thematic classes across the continent, enough to separate forest from urban fabric, though its six-year update cycle will not register the parking lot that became a warehouse last year.
Coverage runs off the shelf across 400 US cities, and the same feature-extraction process reaches more than 100 countries on a custom basis, useful for an operator planning outside its home market. Ecopia names network planning among its own use cases, identifying which buildings and households already have service and which do not, the clutter question a planner otherwise answers parcel by parcel.
Site search and line-of-sight verification
Before a lease is signed, a site acquisition team needs to see the candidate location and everything around it that could block a signal path. Airbus tasks Pléiades Neo at 30-centimeter resolution with intraday revisit for a single rooftop or tower candidate, and its SPOT satellites cover a 60-kilometer swath, wide enough to survey a whole corridor of candidates in one pass.
Confirming line-of-sight between two points needs elevation, not just imagery. Airbus derives an on-demand surface and terrain model from Pléiades Neo stereo pairs, delivered at 0.5-meter resolution anywhere the constellation can task, fine enough to check whether one specific rooftop clears one specific tree line rather than relying on a regional average.
Network build-out planning from building and household counts
Deciding where to extend fiber or 5G coverage next is a counting problem before it is anything else: how many buildings sit in an area, and how many of them are already served. Ecopia AI’s Building-Based Geocoding product covers more than 180 million US building footprints tied to over 270 million address points, updated every year and guaranteed to better than 97 percent accuracy.
Vexcel approaches the same question from its own aerial archive, which reaches 127 million households across 99.6 percent of the US population. Neither figure replaces a franchise map or a permit filing, but both turn a build-out area into a specific, countable target rather than a shaded region on a coverage map.
Vegetation encroachment along towers and backhaul routes
A microwave backhaul link fails the same way a rail corridor does: a tree grows into the signal path and nobody notices until the link degrades. The gap between Intermap’s surface model and its terrain model is the canopy height itself, calculated by differencing the two, and the company’s airborne radar collects both through cloud cover and, per its own coverage record, over dense tropical canopy that optical sensors cannot penetrate.
Catching regrowth between surveys is a repeat-imagery problem. Nearmap’s near-infrared band is built for vegetation health assessment, and its covered metro areas refresh up to three times a year, often enough to flag a stretch of canopy closing in on a route before the next scheduled inspection. Vegetation along a network corridor is the same problem utilities face, covered in our guide to satellite infrastructure monitoring.
What satellite data you need for telecommunications
Different telecom planning tasks call for different sensor modalities, resolutions, and revisit frequencies. The table below maps each common task to the data specifications it requires.
| Task | Sensor modality | Resolution | Revisit | Key index / band |
|---|---|---|---|---|
| Radio propagation modeling | Elevation (DSM/DTM) | 1 m and 6 m | Periodic archive refresh | Surface-minus-terrain height |
| Global terrain baseline | Elevation (wide-area surface model) | 50 cm, 3 m accuracy | Program-cycle refresh | Absolute vertical accuracy |
| Clutter classification | AI-extracted land cover | Object-level (sub-meter) | Annual update | Land use, tree canopy class |
| Candidate site imagery | VHR optical | 0.3-1.5 m | On-demand tasking | Panchromatic and multispectral |
| Line-of-sight verification | On-demand stereo elevation | 0.5 m | On-demand | Point-to-point height profile |
| Building and household counts | AI vector extraction | Building-level footprints | Annual update | Footprint and address counts |
| Household coverage mapping | Aerial optical archive | 7.5-15 cm | Program-cycle refresh | Building attribute extraction |
| Vegetation encroachment monitoring | Aerial multispectral (NIR) | 4.4-7.5 cm | Up to 3x per year | Near-infrared vegetation signal |
With data requirements mapped, the next step is identifying which providers can supply them. The section below covers the most relevant options for telecommunications programs, from elevation specialists to imagery operators and analytics platforms.
Satellite data providers for telecommunications
The providers below have documented telecommunications use cases and data products that map to the tasks in the table above. The mix spans an elevation specialist, satellite operators, an analytics platform, and aerial imagery providers.
| Provider | Type | Best for | Key telecommunications spec | Entry point |
|---|---|---|---|---|
| Intermap | Elevation data provider | RF propagation terrain models | IFSAR DEM at 1-5 m resolution | From $1 per km² |
| Airbus | Satellite operator | Candidate site VHR imagery | Pléiades Neo, 30 cm optical | Quote or UP42 marketplace |
| Vantor | Optical satellite operator | 5G network planning terrain | Vivid Terrain, 50 cm surface model | Quote or UP42 marketplace |
| Ecopia AI | Analytics platform | Broadband build-out mapping | 180M+ US building footprints | Data Portal by request |
| Vexcel | Aerial imagery provider | Household coverage counts | 127M US households covered | Demo request |
| Nearmap | Aerial imagery provider | Corridor vegetation refresh | Refreshed up to 3x per year | Contact sales |
For a ranked shortlist of operators by imagery specification, our guide to the best high-resolution satellite imagery providers covers the optical and aerial side of this market in more depth than a single table can.
How to choose satellite data for telecommunications
What I would use satellite data for in telecoms is planning, not operations. Terrain, clutter and vegetation drive link budgets and rollout sequencing, but no orbital sensor sees a network fault, so the value sits upstream of the operations centre.
The first decision is what the data has to support. A propagation study, a site candidate survey, and a build-out target count are three different products built from three different inputs, and a vendor strong at one is rarely the fastest route to another. Elevation data underpins a coverage prediction, imagery underpins a site decision, and building counts underpin the business case behind both.
Density decides the resolution you actually need. A rural macro site covering tens of kilometers tolerates a coarser regional elevation model, while a dense urban small-cell deployment, where buildings themselves are the obstruction, needs sub-meter imagery and a clutter map that separates a rooftop from the street below it.
Currency matters more here than in most verticals, because the network itself keeps changing. A terrain and clutter dataset is only as useful as its last update, and a new tower, a demolished building, or a felled tree line can invalidate a model without a single pixel moving. Ask a vendor how often its data refreshes before asking how sharp it is.
Telecommunications data buys tend to be an internal engineering decision rather than an externally mandated one, driven by network planning standards and procurement cycles rather than a filing deadline. That leaves budget and program scale to set the pace: a nationwide propagation baseline is cheaper on a regional archive license than on repeated custom tasking, while a contested single-site dispute justifies a one-off, on-demand order.
Data rights still matter for a filing or a franchise negotiation. Verify whether your intended use, including submission to a municipality or inclusion in a regulatory filing, is permitted under the provider’s standard commercial license before the map becomes part of a public record.
Verdict
Telecommunications is a vertical where the data need splits by task rather than by provider type. A propagation study needs elevation, a site survey needs imagery, and a build-out business case needs building counts, and no single dataset answers all three equally well.
Engineers running nationwide propagation baselines should evaluate Intermap and Vantor first, since both package a general-purpose elevation archive into a product aimed at network planners, rather than collecting new data for the purpose. Site acquisition teams need very high resolution optical imagery from Airbus to see a candidate rooftop and confirm line-of-sight before a lease is signed.
Build-out planning is answered by Ecopia AI’s building and address data or Vexcel’s household coverage figures rather than by imagery at all, and ongoing vegetation risk along a backhaul route or access road favors a provider with a fast refresh cycle, such as Nearmap. For a full ranked view of the optical and aerial imagery market, see our high-resolution satellite imagery providers guide.
Frequently asked questions
Below are answers to the questions telecom buyers most commonly ask. Each answer points to the section where the full detail lives.
How is satellite data used in telecommunications?
Satellite and aerial data support five workflows: radio propagation modeling with terrain elevation, clutter and land cover classification, site search and line-of-sight verification, network build-out planning from building counts, and vegetation monitoring along towers and backhaul routes. The detail is in “How satellite data is used in telecommunications“.
What is clutter data and why does radio planning need it?
Clutter data classifies the ground into categories such as buildings, roads, and tree canopy, since a propagation model needs to know whether a signal is crossing a parking lot or passing through a stand of trees. Ecopia AI’s land cover product resolves more than 75 such layers at better than 95 percent geometric accuracy. The category is covered in “How satellite data is used in telecommunications“.
Can satellite imagery help find and verify a cell tower site?
Very high resolution optical imagery lets a site acquisition team see a candidate rooftop or tower location before a visit, and an on-demand elevation model derived from the same stereo imagery confirms whether the path to a neighboring site is actually clear of obstructions. Airbus supplies both from the same Pléiades Neo constellation, detailed in “How satellite data is used in telecommunications“.
Can satellite data show how many households a network will reach?
Building and address data turns a service area into a specific household count rather than a shaded region on a map, and providers in this space have extracted footprint and address data covering well over 100 million US buildings. That build-out use case is covered in “How satellite data is used in telecommunications“.
What resolution do I need for telecom network planning?
A nationwide propagation baseline runs on regional elevation data at 1 to 50 meters, while a single contested site needs sub-meter optical and an on-demand elevation model closer to half a meter. Whichever tier you pick, remember a terrain model is only current as of its last capture date. The full task-to-resolution mapping is in “What satellite data you need for telecommunications“.
Which satellite data providers are best for telecommunications?
Intermap and Vantor lead on elevation data built specifically for radio propagation modeling, Airbus supplies the very high resolution optical that site search and line-of-sight verification need, and Ecopia AI and Vexcel cover building and household counts for build-out planning. Provider details and access models are in “Satellite data providers for telecommunications“.

My passions are Earth Observation and Satellites, and my profession is Data Analysis. I combine both within ObservationData.com to show you the use cases of Earth Observation, to help you find the right provider, and to share your experiences.
