
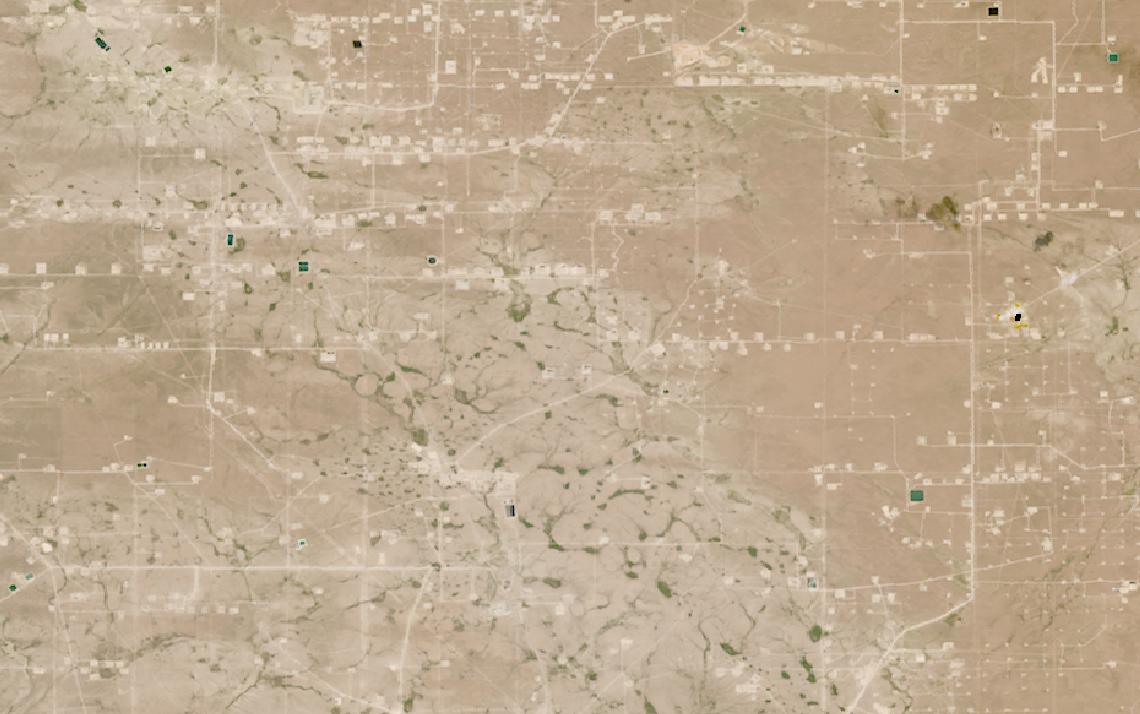
Well pads, pipelines and tank farms sit across terrain ground crews cannot patrol usefully.
Satellite sensors track methane, heat and surface change, giving continuous, comparable records.
This guide covers upstream and midstream oil and gas, to find the right data and provider.
Table of Contents
Key takeaways
- Oil and gas sites already had to file an LDAR program under EU rules, with the first leak survey due by 5 August 2025
- Methane detection runs on daily spectral imaging, but pipeline and tank monitoring lean on hyperspectral and radar instead
- The shortlist narrows fast once you know whether you need facility-level detection or pipeline-wide right-of-way coverage
Before any provider enters the picture, an oil and gas program has to define what the data itself must deliver. The summary below sets out the sensors, resolution, and cadence that most upstream and midstream monitoring workflows share.
| Primary sensors | SWIR spectral imaging, hyperspectral, SAR |
|---|---|
| Working resolution | 25-30 m methane, 8 m hyperspectral |
| Typical revisit | Daily for methane, weekly for tanks |
| Core indices | CH4 concentration, hydrocarbon signature, tank fill |
| Entry cost | Free for non-commercial use, or from $4 per km² |
| Main constraint | Sub-100 kg/hr leaks evade satellite detection |
Those figures cover the baseline that most upstream and midstream programs run on. Programs that depart from it, through site-level LDAR surveys, tank farm inventories, or pipeline right-of-way inspection, change both the sensor mix and the cost.
How satellite data is used in oil and gas
Satellite data enters oil and gas programs at five distinct points, and each one relies on its own sensor type to deliver different decision support to operators, pipeline integrity teams, and compliance staff. Generation, transmission and renewable assets are a separate problem, covered in our guide to satellite imagery for energy, and not repeated here.
Methane leak detection and the LDAR obligation
Article 14 of Regulation (EU) 2024/1787 required existing sites to submit a leak detection and repair program, known as an LDAR program, to their competent authorities by 5 May 2025. New sites face the same requirement within six months of startup, a rolling window rather than a fixed date.
A first Type 2 survey covering all relevant components was due for existing sites by 5 August 2025 as well, with new sites given nine months from startup. Surveys already completed between 3 August 2022 and 4 August 2024 could count toward that first check.
The regulation does not mandate satellites for this work. Article 2 lists a satellite as one of several possible platforms, alongside vehicles, drones, aircraft, and boats, for the site-level measurement that feeds an LDAR program.
For an LDAR program built around satellite site-level measurement, GHGSat’s own constellation is one option: it operates at roughly 25 m resolution and advertises a detection floor as low as 100 kg of methane per hour, which lines up with the regulation’s own threshold for a super-emitting event.
Carbon Mapper makes a comparable dataset available at no cost for non-commercial users. Tanager-1, its JPL-designed hyperspectral instrument flown on a Planet-built satellite bus, images at 30 m resolution, with a detection design target of 90 to 180 kg of methane hourly at 90 percent confidence.
Kayrros brings a different data point to the same conversation: it finds that satellite readings of methane typically come in two to ten times higher than what operators report themselves, a gap regulators reviewing an LDAR filing are increasingly likely to ask about.
Orbital Sidekick approaches the same problem from pipeline level, running onboard AI on its hyperspectral GHOSt satellites to flag both methane plumes and liquid hydrocarbon leaks along a right of way in near-real time.
Pipeline right-of-way monitoring
Pipeline operators must find both leaks and encroachments along corridors that run for thousands of kilometers through terrain no walking inspection covers on a useful cycle.
Orbital Sidekick’s GHOSt satellites capture hyperspectral imagery at 8 m resolution, with onboard AI that flags methane plumes, liquid hydrocarbon leaks, and right-of-way intrusions directly from the spacecraft, before the data ever reaches the ground.
Satelytics runs a comparable service without operating any sensors of its own, ingesting multispectral and hyperspectral imagery from whichever satellite, aircraft, or fixed camera a customer supplies. Its algorithms separate hydrocarbon leaks from produced-water discharge and track vegetation encroachment along the same corridor.
Well pad and site change detection
A new well pad, a fresh drill site, or added tankage at an existing facility all show up as ground disturbance visible from orbit well before a regulator receives any filing.
Kayrros extends its source-agnostic analytics to this problem too, running Site Construction Intelligence and E&P Intelligence products that track oilfield activity and production infrastructure from the same satellite archive it uses for methane and storage analytics.
That kind of activity monitoring matters most for lease compliance and for portfolio managers checking a partner’s stated drilling pace against what the imagery actually shows.
Flaring measurement
A flare stack burns hot enough that its thermal signature reaches orbit well before any operator files a disclosure report, which is why thermal infrared is the direct sensor for this task.
A flare that is not fully combusting also releases unburned methane alongside the CO2 it is designed to produce, which links flaring performance directly to the same emissions accounting that methane satellites and analytics platforms already cover.
Thermal data covering flare stacks is available through multi-source access points such as Sfera Technologies, which lists oil and gas flare monitoring among the applications for the thermal imagery it brokers from third-party operators, alongside urban heat and wildfire detection.
Storage tank levels and crude inventories
Floating-roof tank levels are a direct proxy for how much crude sits in storage, and the roof height itself is visible in ordinary satellite imagery, which is why several independent products measure it on a recurring schedule.
Ursa Space runs a weekly, SAR-based Global Oil Storage product that measures floating-roof tank fill through cloud cover, since radar does not depend on a clear sky the way optical imagery does.
Kayrros tracks more than 12,000 crude oil storage tanks worldwide through its Crude Oil Intelligence product, reporting an 82 percent correlation between its inventory readings and Brent prices, with a lead time of one to three weeks over official data.
Kpler approaches the same asset from the trading side, fusing satellite imagery with AIS vessel tracking and customs records into an inventories product that covers more than 17,000 crude oil storage tanks, plus global LNG storage, alongside the tanker movements feeding and draining them.
What satellite data you need for oil and gas
Different tasks across the well pad, the pipeline, and the tank farm call for different sensor modalities, resolutions, and revisit frequencies. The table below maps each common task to the data specifications it requires.
| Task | Sensor modality | Resolution | Revisit | Key index / band |
|---|---|---|---|---|
| Methane super-emitter detection | SWIR spectral imaging | 25-30 m | Daily to weekly | CH4 column concentration |
| Liquid hydrocarbon pipeline leaks | Hyperspectral | 8 m | Sub-daily to weekly | Hydrocarbon spectral signature |
| Pipeline right-of-way encroachment | Multispectral optical, SAR | 3-10 m | 5-12 days | NDVI, change detection |
| Well pad and site construction tracking | Multispectral optical | 3-10 m | Near-daily to weekly | Change detection |
| Flare stack detection | Thermal infrared (MWIR) | High-resolution | Per tasking | Heat signature, hotspot |
| Wide-area flaring and venting | Thermal infrared | 375 m-1 km | Sub-daily | Brightness temperature |
| Floating-roof tank fill measurement | SAR | 1-10 m | Weekly | Backscatter-derived fill level |
| Crude and LNG inventory tracking | Optical and AIS fusion | Varies | Weekly | Tank count, vessel position |
With the data requirements mapped, the next step is identifying which providers can supply them. The section below covers the most relevant options for oil and gas programs, from dedicated methane satellites to multi-source analytics platforms.
Satellite data providers for oil and gas
The providers below have documented oil and gas use cases and data products that map to the tasks in the table above. The mix spans dedicated methane satellite operators, hyperspectral pipeline monitors, and multi-source analytics platforms.
| Provider | Type | Best for | Key oil and gas spec | Entry point |
|---|---|---|---|---|
| GHGSat | Satellite operator | Facility methane leak detection | 25 m resolution, 100 kg/hr floor | Contact for quote |
| Kayrros | Analytics platform | Methane and crude tank analytics | 12,000+ crude oil tanks tracked | Demo request |
| Carbon Mapper | Nonprofit data provider | Independent methane verification | 30 m resolution, 90-180 kg/hr PoD | Free for non-commercial use |
| Orbital Sidekick | Hyperspectral satellite operator | Pipeline leak and RoW monitoring | 8 m hyperspectral, onboard AI | Quote-based |
| Ursa Space | SAR analytics aggregator | Weekly tank fill measurement | Weekly SAR floating-roof tank fill | Contact for pricing |
| Satelytics | Analytics platform | Pipeline and ROW leak detection | Sensor-agnostic imagery ingestion | Contact for pricing |
| Sfera Technologies | Multi-source access point | Multiple sensor types, one contact | Optical, SAR, and thermal data | From $4 per km² optical |
For a ranked shortlist of methane and emissions specialists, our guide to the best hyperspectral imagery providers covers the sensor type increasingly used for both leak detection and pipeline monitoring, while our broader best satellite imagery providers guide covers the wider optical and radar market beyond methane-specific analytics.
How to choose satellite data for oil and gas
What I would clarify with any vendor here is detection threshold versus attribution. Finding a plume is the easy half; tying it to a specific facility with a defensible number is the half that decides whether the finding survives a dispute.
The first decision is what the data has to prove. An LDAR-adjacent methane record and a pipeline right-of-way alert feed are different products built from different sensors, and a vendor strong at one is rarely the cheapest route to the other.
Regulatory exposure sets the second cut. Operators already running an LDAR program should treat satellite monitoring as a complement to ground and aerial surveys, not a replacement, and should expect their own emissions data to be checked against a global monitoring tool the Commission must launch by 5 August 2026.
Asset type decides the sensor. Wellheads and compressor stations call for methane-specific spectral imaging. Pipeline corridors need hyperspectral or multispectral optical for leaks and encroachment. Tank farms are a SAR or optical measurement problem rather than a gas-detection one.
Budget scales with cadence and coverage area. Continuous monitoring of a large well field or pipeline network is cheaper on an area or asset subscription than on per-scene ordering, while a one-off site survey on a single asset is the case for per-image pricing without an annual commitment.
Data rights need a closer look here than in most other verticals: verify whether your intended use, including regulatory submissions, sharing with joint-venture partners, or public disclosure of a detected leak, is permitted under the provider’s standard license before committing.
Verdict
Oil and gas is the vertical where satellite data now sits closest to a live compliance deadline. Both a nonprofit mission and several commercial operators already sell facility-level methane detection, and the underlying LDAR obligation has applied to existing EU sites since 2025.
Linear infrastructure changes the requirement again: a pipeline right-of-way calls for hyperspectral or sensor-agnostic analytics watching an entire corridor on a repeating cycle, not a single wellhead. Midstream teams tracking tank farms and crude inventories turn instead to SAR or fused trade-intelligence products.
Programs spanning methane compliance, pipeline integrity, and storage monitoring draw on spectral, radar, and thermal data from different vendors, and rarely settle on one source once the full asset base is in view. For a full ranked view of the imagery market, see our satellite imagery providers guide. For methane and pipeline-specific analytics, the hyperspectral imagery providers ranking covers the current commercial options.
Frequently asked questions
Below are answers to the questions oil and gas buyers most commonly ask. Each answer points to the section where the full detail lives.
How is satellite data used in oil and gas?
Satellite data supports five core workflows: methane leak detection tied to the LDAR obligation, pipeline right-of-way monitoring, well pad and site change detection, flaring measurement, and storage tank levels and crude inventories. The detail is in “How satellite data is used in oil and gas“.
Does EU law require satellite monitoring for oil and gas methane?
No. Regulation (EU) 2024/1787 requires an LDAR program and periodic leak surveys, and lists a satellite as one of several possible platforms for site-level measurement, alongside vehicles, drones, and aircraft, rather than mandating satellite-based LDAR. The obligation is covered in “How satellite data is used in oil and gas“.
What resolution do I need for oil and gas monitoring?
Today’s dedicated methane satellites work at 25 to 30 m, fine enough to pin a plume to a single facility rather than a whole region. Pipeline hyperspectral monitoring runs at around 8 m, while well pad and construction tracking uses 3 to 10 m multispectral optical. The full task-to-resolution mapping is in “What satellite data you need for oil and gas“.
Can satellites detect a pipeline leak before it is reported?
Yes. Hyperspectral sensors read the spectral signature of methane and liquid hydrocarbons directly, and onboard processing on some constellations can flag a leak within the same pass that captured it, well ahead of routine ground inspection. Provider approaches are compared in “Satellite data providers for oil and gas“.
Which satellite data providers are best for oil and gas?
GHGSat and Carbon Mapper are the two dedicated methane satellite operators, Kayrros adds the widest analytics coverage across methane and crude storage, and Orbital Sidekick and Satelytics cover pipeline right-of-way monitoring from hyperspectral and sensor-agnostic angles. Provider details are in “Satellite data providers for oil and gas“.
How are crude oil storage levels tracked from orbit?
Floating-roof tank height is visible in ordinary satellite imagery and directly proportional to how much crude sits in the tank, which lets both dedicated SAR products and broader trade-intelligence platforms report fill levels on a weekly cycle. Sensor choice by task is discussed in “How to choose satellite data for oil and gas“.

My passions are Earth Observation and Satellites, and my profession is Data Analysis. I combine both within ObservationData.com to show you the use cases of Earth Observation, to help you find the right provider, and to share your experiences.
