
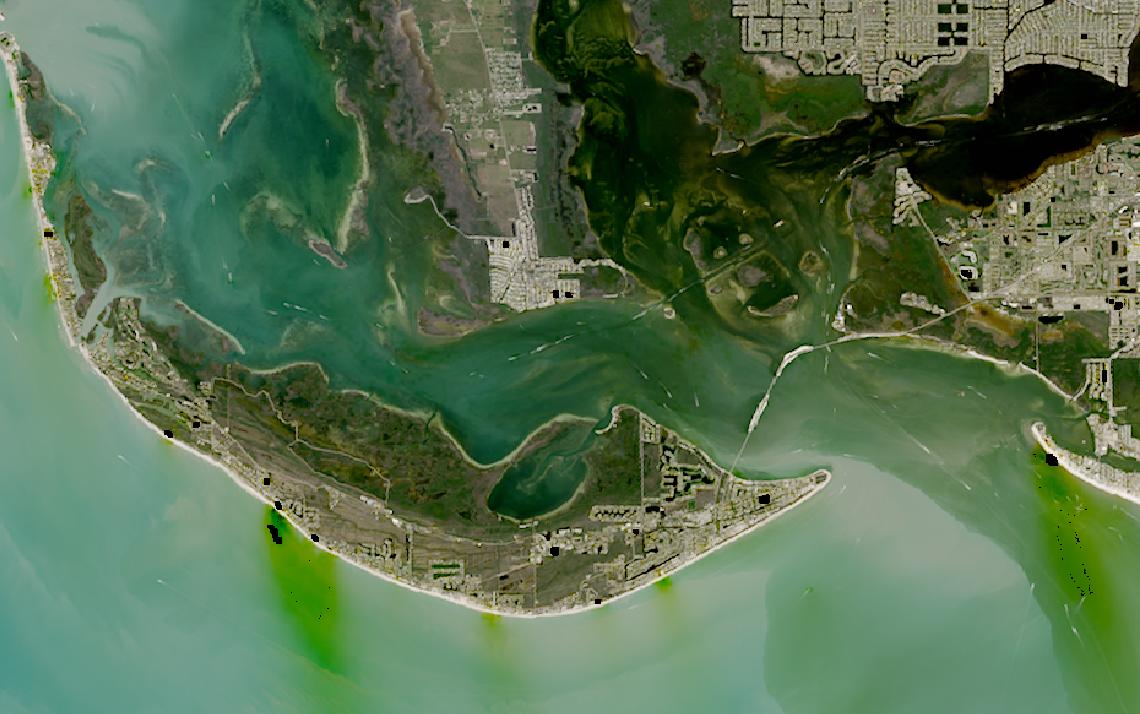
No adjuster can inspect every roof before a storm season begins.
Aerial and satellite imagery captures the same address on schedule, turning condition into a dated record.
This guide matches insurance tasks to the right data and provider.
Table of Contents
Key takeaways
- Insurance draws on satellite and aerial data at three points in the policy cycle, not just after a loss
- The single biggest lever is a dated archive of the same address, proving pre-loss condition
- The shortlist narrows fast once you know whether you need underwriting exposure data or claims-stage imagery
Before any provider enters the picture, an insurance program has to settle what the data must prove and at what stage of the policy lifecycle. The summary below sets out the sensors, resolution, and cost that property risk and claims imagery depend on.
| Primary sensors | Aerial VHR optical, SAR, multispectral |
|---|---|
| Working resolution | 2.5-15 cm aerial, 0.16-27 m satellite |
| Typical revisit | Annual aerial refresh, daily satellite |
| Core indices | Roof condition, flood depth, footprints |
| Entry cost | From $4 per km² (optical archive) |
| Main constraint | Aerial coverage is metro and country limited |
Those figures cover the baseline most property programs run on. Programs built around catastrophe response or portfolio-wide accumulation risk pull in different sensors entirely, covered next.
How satellite data is used in insurance
Satellite and aerial data enter the insurance cycle at three distinct stages: before a policy is written, after a loss occurs, and across a portfolio as a whole, each pulling on a different sensor and a different cadence.
Underwriting and property exposure
Before a policy is written, an underwriter needs to know what is actually on the parcel: roof condition, material, shape, and hazards like pools or overhanging trees.
EagleView extracts more than 125 attributes per property from its own aerial capture, at resolution down to one inch, 2.54 cm, with roof measurements the company states are accurate to 98.77 percent. Nineteen of the top twenty US property insurers are named customers.
Nearmap runs a comparable stack: more than 130 AI-derived property insights, covering roof condition, materials, and peril risk, drawn from its own 4.4 to 7.5 cm aerial imagery refreshed up to three times a year. Its Betterview platform, an acquisition built specifically for insurance underwriting workflows, turns those attributes into a risk score directly.
Exposure mapping starts even earlier for some programs. Ecopia AI applies AI-based feature extraction to partner-sourced aerial and satellite imagery, producing more than 180 million US building footprints with FEMA flood zone data pre-appended, contractually guaranteed at better than 97 percent accuracy.
Pre-event baseline imagery
The single biggest operational lever in insurance imagery is not the post-loss photo, it is the picture taken before anything happened. A dated archive of the same address, captured on a fixed schedule long before a claim exists, is what lets an insurer or adjuster prove condition at the moment coverage began.
Vexcel has operated as the backbone of the Geospatial Insurance Consortium since 2017, and the company now describes its imagery as powering more than 90 percent of the providers serving the US property insurance market. That scale exists because the archive spans more than 45 countries and refreshes continuously, not because a flight was ordered for one claim.
Nearmap’s US archive reaches back to 2014, and EagleView’s spans more than 3.5 billion historical images collected over more than two decades. Either record can settle a dispute over what stood on a property, and when, well before a loss is filed.
Post-catastrophe damage assessment
Once an event happens, the same capabilities turn toward claims rather than underwriting: rapid re-flights of the affected area, all-weather radar where cloud cover blocks aircraft, and AI scoring that turns a raw image into a damage estimate.
Vexcel’s Gray Sky program has flown rapid-response imagery after hurricanes, tornadoes, and wildfires since 2017, historically delivered on behalf of the insurance industry through the GIC and now a core Vexcel product covering the US and select international markets.
Nearmap’s ImpactResponse delivers post-event imagery aligned to FEMA damage classification, and EagleView pairs its aircraft-based Reveal program with Assess, an on-demand drone service built specifically for insurance claims triage after the aircraft has passed.
ICEYE approaches the same event from orbit. Its SAR constellation images through cloud and darkness, and the company sells Flood Insights and Wildfire Insights alongside a hurricane product for insurers, an approach that does not wait for a clear sky to fly. AXA and Munich Re are named among its insurance customers, and the claims workflow this feeds into is covered in more depth in our guide to satellite imagery for disaster response.
Flood and hazard modeling
Flood exposure is as much a data-fusion problem as an imagery problem: a claims team needs to know which buildings sit in a flood zone before water ever rises, and how deep it got once it did.
Ecopia AI pre-appends FEMA flood zone data to its US building footprint layer, giving an underwriter or a portfolio manager zone-level exposure without a separate lookup for every one of its mapped structures.
That zone letter carries legal weight, not just risk signal. Zones A, AE, AH, AO, AR and A99 count as high-risk flood areas, V and VE add coastal storm waves, and in a community inside the National Flood Insurance Program a federally backed mortgage requires flood insurance in those zones.
For water that has already arrived, ICEYE’s radar imagery works regardless of cloud cover, and building-level flood depth is among the natural-catastrophe products the company lists for insurance customers, alongside its wildfire and hurricane lines.
Fraud detection and claims validation
A disputed claim often comes down to timing: did the damage predate the policy, or the loss event itself? A historical, timestamped image is the only independent witness that cannot be staged after the fact.
Vexcel lists Special Investigations Unit fraud detection as a named use case for its aerial archive, using timestamped historical imagery to check whether a claimed loss is consistent with the property’s condition on record before the date of loss.
The same logic extends to any provider with a deep, dated archive: Nearmap’s US coverage from 2014 and EagleView’s more than two decades of capture both function as an independent record an adjuster did not create and cannot alter.
Portfolio and accumulation risk
Beyond any single property, an insurer needs to know how much risk sits in one place at once, a wildfire-prone county, a flood plain, a hurricane corridor, before the next event decides it for them.
Supervisors ask the same question from the other direction. EIOPA’s protection gap dashboard sets insured against economic losses for 30 European countries, peril by peril and back to 1980, which gives a portfolio team an outside reference for its own accumulation view.
Planet’s PlanetScope constellation revisits the same ground near-daily at 3 to 3.7 m resolution, priced as a standing area subscription rather than per-scene orders, which suits continuous monitoring of an entire book of business. Its Planetary Variables line lists parametric insurance products, including soil moisture, among its stated use cases.
ICEYE’s SAR constellation adds a global, all-weather layer for portfolios that span cloudy or nighttime-exposed regions its optical peers cannot always reach on schedule. For a program that needs several of these sensor types under one relationship rather than several vendor contracts, Sfera Technologies packages optical, SAR, and thermal access as a single point of contact.
What satellite data you need for insurance
Different stages of the insurance cycle call for different sensors, resolutions, and revisit frequencies. The table below maps each common task to the data specifications it requires.
| Task | Sensor modality | Resolution | Revisit | Key index / band |
|---|---|---|---|---|
| Underwriting property attributes | Aerial VHR optical | 2.5-15 cm | Annual to 3x/year | Roof condition score |
| Pre-event baseline archive | Aerial VHR optical (archive) | 2.5-15 cm | Historical, dated | Timestamped imagery |
| Post-event rapid re-flight | Aerial VHR optical | 2.5-7.5 cm | On-demand, rapid | Damage classification |
| All-weather catastrophe response | SAR (X-band) | 16 cm-27 m | Daily | Flood extent, backscatter |
| Flood zone exposure mapping | AI feature extraction (optical-derived) | Sub-meter derived | Annual update | Building footprints, flood zone |
| Fraud and claims validation | Dated optical archive | 2.5-15 cm | Historical, dated | Timestamped imagery |
| Portfolio-wide monitoring | Multispectral optical | 3-3.7 m | Near-daily | Parametric soil moisture |
With data requirements mapped, the next step is identifying which providers can supply them. The section below covers the most relevant options for insurance programs, from aerial capture operators to SAR and multi-source access points.
Satellite data providers for insurance
The providers below have documented insurance use cases and data products that map to the tasks in the table above. The mix spans aerial imagery operators, a SAR satellite operator, and a multi-source access point.
| Provider | Type | Best for | Key insurance spec | Entry point |
|---|---|---|---|---|
| ICEYE | SAR satellite operator | All-weather catastrophe response | Natural catastrophe Insights | Quote or UP42 marketplace |
| Vexcel | Aerial imagery provider | Underwriting-to-claims imagery | Backbone of the insurance GIC | Demo request |
| Nearmap | Aerial imagery provider | Urban risk scoring, US/AU/NZ | Betterview underwriting AI | Contact sales |
| EagleView | Aerial imagery provider | Claims triage and roof reports | 98.77% roof measurement accuracy | Per-report or subscription |
| Planet | Satellite operator | Portfolio-wide risk monitoring | Parametric soil moisture data | Imagery from $2,700 per year |
| Sfera Technologies | Multi-source access point | Several sensor types in one contract | Optical, SAR, thermal access | From $4 per km² optical |
For a fuller comparison of resolution, coverage, and pricing across this market, our guide to the best high-resolution satellite imagery providers covers the aerial and VHR options in depth, and the best satellite imagery providers guide ranks the field across every sensor type and access model.
How to choose satellite data for insurance
The value I see for insurers sits before and after the event, not during it. In my assessment, portfolio exposure and post-event damage assessment are where the imagery pays, while live loss adjustment still needs someone on the ground.
The first question is what the data has to prove, not just what it should show. A pre-loss underwriting record, a post-event damage estimate, and a portfolio-wide accumulation view are different deliverables built from different capture methods, and a provider strong at one is rarely the fastest route to another.
Geography narrows the field quickly. Vexcel, Nearmap, and EagleView each cover specific countries and metro markets rather than the whole globe, while ICEYE’s radar and Planet’s optical constellation reach any address on the planet on a tasked or subscription basis. A book of business concentrated in a few metro areas is well served by an aerial program; one spread across continents is not.
Cadence decides the commercial model. Continuous monitoring of a large book of business is cheaper on an area subscription than on per-scene ordering, while a one-off underwriting survey or a post-event damage run is the case for per-report or per-order pricing without an annual commitment.
Data rights are worth checking before committing budget. Confirm whether the standard license covers internal underwriting and claims use as well as submission as evidence in a coverage dispute or litigation, since imagery bought for one purpose is not always cleared for the other.
Verdict
Insurance is the vertical where the value of satellite and aerial data is asymmetric: a dated record taken before a loss is worth more than nearly any image taken after one, because it is the only evidence no claim can retroactively create.
For underwriting and pre-loss baselines, Vexcel’s role as the backbone of the Geospatial Insurance Consortium and its reach across more than 90 percent of US property insurers make it a default reference point, alongside Nearmap and EagleView’s own AI-derived attribute stacks. For catastrophe response, ICEYE’s all-weather SAR reaches an affected area regardless of cloud cover, and Ecopia AI’s flood-zone-tagged footprints answer the exposure question before an event ever happens.
Programs that span the full cycle, underwriting exposure, post-event claims, and portfolio-wide accumulation risk, draw on aerial, SAR, and multispectral data from different operators, and benefit from a single access point rather than managing several vendor relationships at once. For the full ranked market, see our guides to the best high-resolution satellite imagery providers and the best satellite imagery providers.
Frequently asked questions
Below are answers to the questions insurance buyers most commonly ask. Each answer points to the section where the full detail lives.
How is satellite and aerial data used in insurance?
Insurance draws on this data at three points: underwriting and property exposure, post-catastrophe damage assessment, and portfolio-wide accumulation risk, with fraud detection and flood modeling running alongside the first two. The full workflow breakdown is in “How satellite data is used in insurance“.
What is the biggest advantage of satellite and aerial imagery for insurers?
The single biggest advantage is a dated, repeatable record of the same address captured before anything happens, which proves pre-loss condition in a way no post-event photograph can match. That baseline argument is covered in more detail in “How satellite data is used in insurance“.
Can satellite imagery prove when property damage occurred?
Yes, when the imagery is dated and independently captured, which is exactly what a multi-year aerial archive provides. Insurers and adjusters use this to check whether a documented condition existed before the current policy or claim, rather than relying on either party’s own photographs. This use case is covered in “How satellite data is used in insurance“.
What resolution do insurers need for property and claims imagery?
Underwriting and claims work at 2.5 to 15 cm, the range aerial programs deliver for individual roof and property attributes, while portfolio-wide satellite monitoring runs at 3 to 3.7 m and all-weather SAR spans a wider range again. The full task-to-resolution mapping is in “What satellite data you need for insurance“.
Which satellite and aerial data providers are best for insurance?
Vexcel, Nearmap, and EagleView lead on the aerial imagery and AI-derived property attributes that underwriting and claims teams use daily, ICEYE covers all-weather catastrophe response by SAR, and Planet suits portfolio-wide monitoring at scale. Provider details and access models are in “Satellite data providers for insurance“.
How do insurers detect fraudulent or misdated claims with imagery?
A timestamped historical image works as an independent witness that cannot be staged after the fact, which is why Vexcel lists Special Investigations Unit fraud detection as a named use case for its archive. Licensing this kind of evidentiary use is discussed in “How to choose satellite data for insurance“.

My passions are Earth Observation and Satellites, and my profession is Data Analysis. I combine both within ObservationData.com to show you the use cases of Earth Observation, to help you find the right provider, and to share your experiences.
