
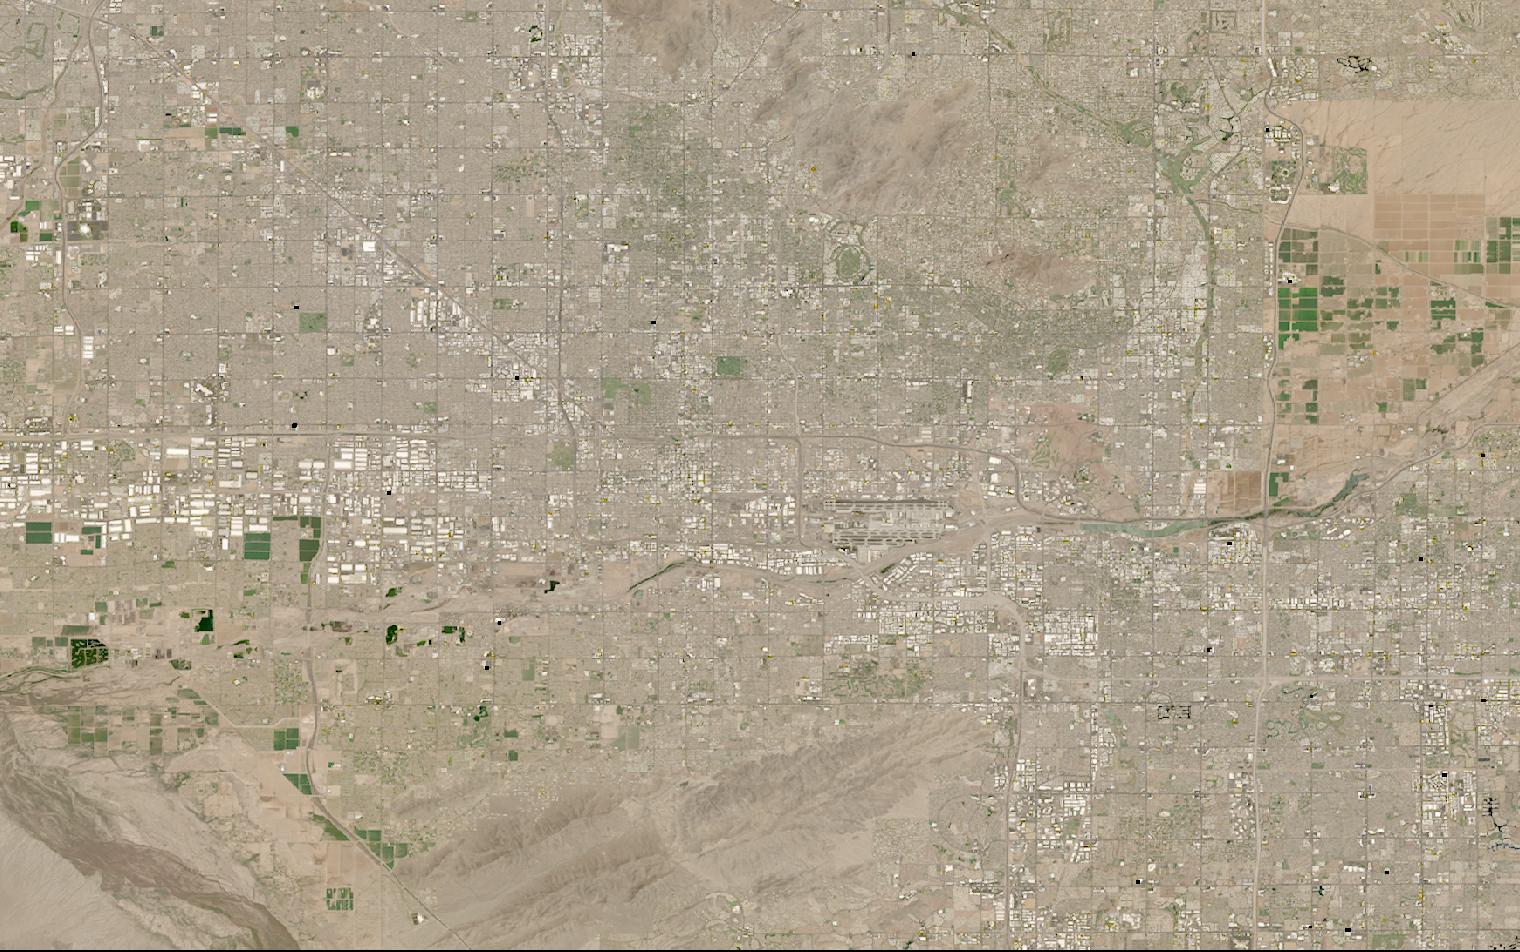
Heat, air pollution and disease risk shift block by block, faster than clinics and monitoring stations can track.
Satellite data measures the same ground repeatedly, turning heat and land cover into comparable citywide readings.
This guide matches public health tasks to the right data and provider.
Table of Contents
Key takeaways
- Public health teams need exposure mapped across a whole city or region, not scattered clinic records
- No satellite reads what a person breathes or confirms a diagnosis, only heat, land cover, and pollutant columns at scale
- The shortlist narrows fast once you know whether you need thermal imagery, land cover analytics, or atmospheric monitoring
Before any provider enters the picture, a public health program has to settle what it needs from the data itself. The summary below sets out the sensors, resolution, and cadence that operational exposure monitoring depends on.
| Primary sensors | Thermal infrared, multispectral optical, atmospheric spectrometer |
|---|---|
| Working resolution | 3.5-30 m for heat and land cover, kilometer-scale for air columns |
| Typical revisit | Near-daily optical and thermal, hourly atmospheric sounding |
| Core indices | Land surface temperature, NDVI, pollutant column density |
| Entry cost | Free public data, or from $28 per month |
| Main constraint | Surfaces and columns, not people or cases |
Those figures cover the baseline most exposure-monitoring programs run on. Programs built around regulatory air quality reporting, disease surveillance, or heat-emergency response change both the sensor mix and how the output gets used.
How satellite data is used in public health
Satellite data enters public health work at four distinct points, each relying on a different sensor type, bounded throughout by one hard limit on what any of it can resolve.
What satellite data can and cannot tell you about health
No satellite measures what a person actually breathes. Instruments looking down through the atmosphere read column densities across its full depth, not the concentration at street level where people live and work.
Converting a column reading into a ground-level number takes atmospheric models and calibration against surface monitors, and satellites see no people and no diagnosed cases either way. What the data delivers instead is exposure at the area level: heat, land cover, standing water, smoke.
Urban heat islands and heat-related illness risk
Extreme heat is one of the most direct satellite-to-health links available: land surface temperature maps where a city actually overheats, block by block, rather than relying on a handful of ground weather stations to represent an entire metro area.
constellr’s HiVE thermal satellites measure land surface temperature at 30 meters natively, sharpened to 10 meters, with a 1.5-day average revisit and 1.0 to 1.5 kelvin absolute accuracy, day and night. That combination lets a health department distinguish a park from a parking lot on the same block.
SatVu approaches the same problem from a sharper angle: its HotSat satellites resolve thermal imagery to 3.5 meters across a 16-square-kilometer scene, day and night, the highest resolution in commercial thermal imaging today. That catches heat retention at the scale of a single building or rooftop rather than a city block. Heat exposure is also a long-run signal, tracked in our guide to satellite data for climate.
Tracking air pollutant columns under Directive (EU) 2024/2881
Directive (EU) 2024/2881 turns ambient air quality into a harder legal target. Member states must transpose the directive’s core provisions, Annexes I through X included, into national law by 11 December 2026.
The same directive sets the limit values those laws exist to enforce: by 1 January 2030, annual average concentrations must fall to 10 micrograms per cubic meter for PM2.5, 20 for PM10, and 20 for nitrogen dioxide.
A second clock is already running underneath that 2030 date. Where pollutant levels between 1 January 2026 and 31 December 2029 sit above the 2030 limits, the directive requires the affected zone to adopt an air quality roadmap now, ahead of the deadline itself.
Only one recital, not a binding article, names Earth observation directly. It encourages member states to draw on the Copernicus Atmosphere Monitoring Service, which folds in column data from the Sentinel-5P satellite’s TROPOMI instrument, phrased as an encouragement rather than a requirement. Compliance itself rests on fixed ground monitoring stations, with modeling and indicative measurements filling the space between them.
Sentinel Hub provides programmatic access to that same Sentinel-5P archive, alongside the rest of the Copernicus fleet, for teams that want to query pollutant columns directly rather than through a pre-built dashboard.
Mapping vector-borne disease and environmental health risk
Mosquito-borne disease and other environmental health risks track land cover and standing water more reliably than they track any single case count, since breeding habitat and land-use change shift faster than ground surveillance can be re-run on foot.
Impact Observatory turns Sentinel-2 and PlanetScope imagery into classified land cover maps, 15 classes at 10 meters or 17 classes at 3 meters, built with AI classification rather than manual delineation, updated on a seasonal or annual cycle.
Planet’s PlanetScope constellation revisits the globe near-daily at 3 to 3.7 meters, catching standing water and vegetation change on a cadence dense enough to track breeding habitat as it forms and drains, rather than waiting for the next scheduled pass.
Extreme heat and severe weather early warning
Heat waves and severe weather events drive acute spikes in emergency room visits and heat-related mortality, and the response window for a public health agency is measured in hours, not the weeks a seasonal outlook covers.
Tomorrow.io operates its own weather-sensing satellite constellation, a passive microwave sounder fleet reading atmospheric temperature and water vapor profiles across a 2,200-kilometer swath. The constellation has reached a 60-minute global revisit, feeding the company’s Resilience Platform, which is built for early warning rather than a weekly forecast update.
What satellite data you need for public health
Different public health tasks call for different sensor modalities, resolutions, and revisit rates. The table below maps each common task to the data specifications it requires.
| Task | Sensor modality | Resolution | Revisit | Key index / band |
|---|---|---|---|---|
| Urban heat island mapping | Thermal infrared | 3.5-30 m | 1.5-day to near-daily | Land surface temperature |
| Heat exposure risk modeling | Thermal infrared and optical | 10-30 m | Daily to seasonal | LST anomaly, land cover |
| Ambient air pollutant columns | Atmospheric spectrometer | Column density, km-scale | Daily | NO2, PM column density |
| Vector habitat and standing water | Multispectral optical | 3-10 m | Near-daily to weekly | NDWI, NDVI |
| Land cover change for risk mapping | Multispectral optical, AI classification | 3-10 m | Seasonal to annual | Land cover class |
| Wildfire smoke and air quality alerts | Thermal infrared and optical | 30-375 m | Sub-daily | Brightness temperature, smoke index |
| Extreme heat and storm early warning | Passive microwave sounder | 14-26 km | Sub-hourly | Temperature, water vapor profile |
With data requirements mapped, the next step is identifying which providers can supply them. The section below covers the most relevant options for public health programs, from thermal operators to land cover analytics.
Satellite data providers for public health
The providers below have documented public health use cases and data products that map to the tasks in the table above. The mix spans thermal and weather satellite operators, a data access platform, and a land cover analytics provider.
| Provider | Type | Best for | Key health spec | Entry point |
|---|---|---|---|---|
| constellr | Thermal operator | Urban heat island mapping | Land surface temperature at 30 m | Quote or UP42 marketplace |
| SatVu | Satellite operator | Building-scale heat detection | 3.5 m thermal resolution | Quote-based |
| Sentinel Hub | Data platform | Open access to Sentinel-5P archive | Sentinel-5P air quality data | From $28 per month |
| Planet | Satellite operator | Near-daily land and water change | PlanetScope at 3 m, near-daily | Imagery from $2,700 per year |
| Impact Observatory | Analytics platform | Land cover for vector habitat | 10 m annual, 15 land classes | From $2 per km² |
| Tomorrow.io | Weather satellite operator | Extreme heat and storm alerts | 60-minute global sounder revisit | Quote-based |
For a ranked shortlist of the thermal operators best suited to heat-health work, our guide to the best thermal satellite imagery providers covers the full market with head-to-head specifications.
How to choose satellite data for public health
The first decision is which exposure you are measuring. Heat, air pollution, and vector habitat are three different physical signals, each requiring its own sensor type, and a platform strong at one is rarely the fastest route to another.
Timeline sets the second cut. A heat-emergency response program needs a same-day or sub-daily feed, which favors Tomorrow.io’s atmospheric constellation or a thermal tasking request to constellr or SatVu, while an epidemiological study of vector habitat over several seasons is better served by an annual land cover archive than by same-day imagery.
Budget follows a similar split. Public Copernicus data, including Sentinel-5P for air quality, costs nothing to access; a platform subscription like Sentinel Hub adds convenience and processing at a modest monthly rate; and a purpose-built analytics layer such as Impact Observatory’s classified land cover carries a per-square-kilometer fee for the modeling behind it.
Data rights and privacy deserve a specific check in health work: verify whether pairing satellite-derived exposure layers with clinical or case-location data triggers your organization’s own privacy rules, since the satellite side of that pairing carries no personal data to begin with. The most common mistake is buying resolution before deciding what actually needs to be resolved.
Verdict
Public health is a vertical where the honest caveat matters as much as the data: satellite instruments deliver area-wide exposure evidence, not a diagnosis and not a ground-level pollutant reading, and every credible program treats the imagery as one input alongside ground monitors, models, and case data.
Heat-related risk has the clearest satellite-to-outcome path today, with constellr and SatVu both delivering sub-10-meter thermal detail that a city can act on directly. Air quality reporting under Directive (EU) 2024/2881 leans on Sentinel-5P and the Copernicus Atmosphere Monitoring Service, both free, with Sentinel Hub as the fastest way to work with that archive directly.
Programs tracking vector-borne disease or broader environmental health risk get the most from Impact Observatory’s classified land cover and Planet’s near-daily monitoring, and a heat-wave or severe-weather early warning program is Tomorrow.io’s specific strength. For a full ranked view of the thermal imagery market most relevant here, see our thermal satellite imagery providers guide.
Frequently asked questions
Below are answers to the questions public health buyers most commonly ask. Each answer points to the section where the full detail lives.
How is satellite data used in public health?
Satellite data covers four active workflows: urban heat mapping, ambient air pollutant tracking under EU air quality law, vector-borne disease and land cover risk mapping, and extreme heat or severe weather early warning, framed throughout by a hard limit on what any sensor can resolve. The detail is in “How satellite data is used in public health“.
Can satellites measure the air pollution people actually breathe?
Not directly. Instruments read column densities across the full depth of the atmosphere, not concentration at street level, so converting one into the other needs atmospheric models and calibration against ground monitors. That gap, and what satellite data delivers instead, is covered in “How satellite data is used in public health“.
Does the EU’s Air Quality Directive require satellite monitoring?
No. Directive (EU) 2024/2881 only encourages the use of Copernicus atmospheric data in one non-binding recital, while compliance itself rests on fixed ground monitoring stations, supplemented by modeling and indicative measurements. The full breakdown of the directive’s deadlines is in “How satellite data is used in public health“.
What resolution do I need for urban heat mapping?
Land surface temperature at 10 to 30 meters is enough to separate a park from pavement across a city, and sharpened products reach 3.5 to 10 meters for single-building detail. Atmospheric and weather data, by contrast, works at the kilometer scale rather than the building scale. The full task-to-resolution mapping is in “What satellite data you need for public health“.
Which satellite data providers are best for public health?
constellr and SatVu lead on thermal resolution for urban heat mapping, Sentinel Hub is the fastest route to the free Sentinel-5P air quality archive, Impact Observatory and Planet cover land cover and environmental risk mapping, and Tomorrow.io is the dedicated option for severe weather early warning. Provider details and access models are in “Satellite data providers for public health“.
Can satellite data replace ground-based health surveillance?
No, satellite data narrows down where and when exposure risk is rising, but it does not diagnose a case or replace a clinic, a monitoring station, or a case-reporting system. It works as an area-wide layer that ground surveillance still has to confirm. Weighing that role against a program’s budget is covered in “How to choose satellite data for public health“.

My passions are Earth Observation and Satellites, and my profession is Data Analysis. I combine both within ObservationData.com to show you the use cases of Earth Observation, to help you find the right provider, and to share your experiences.
