
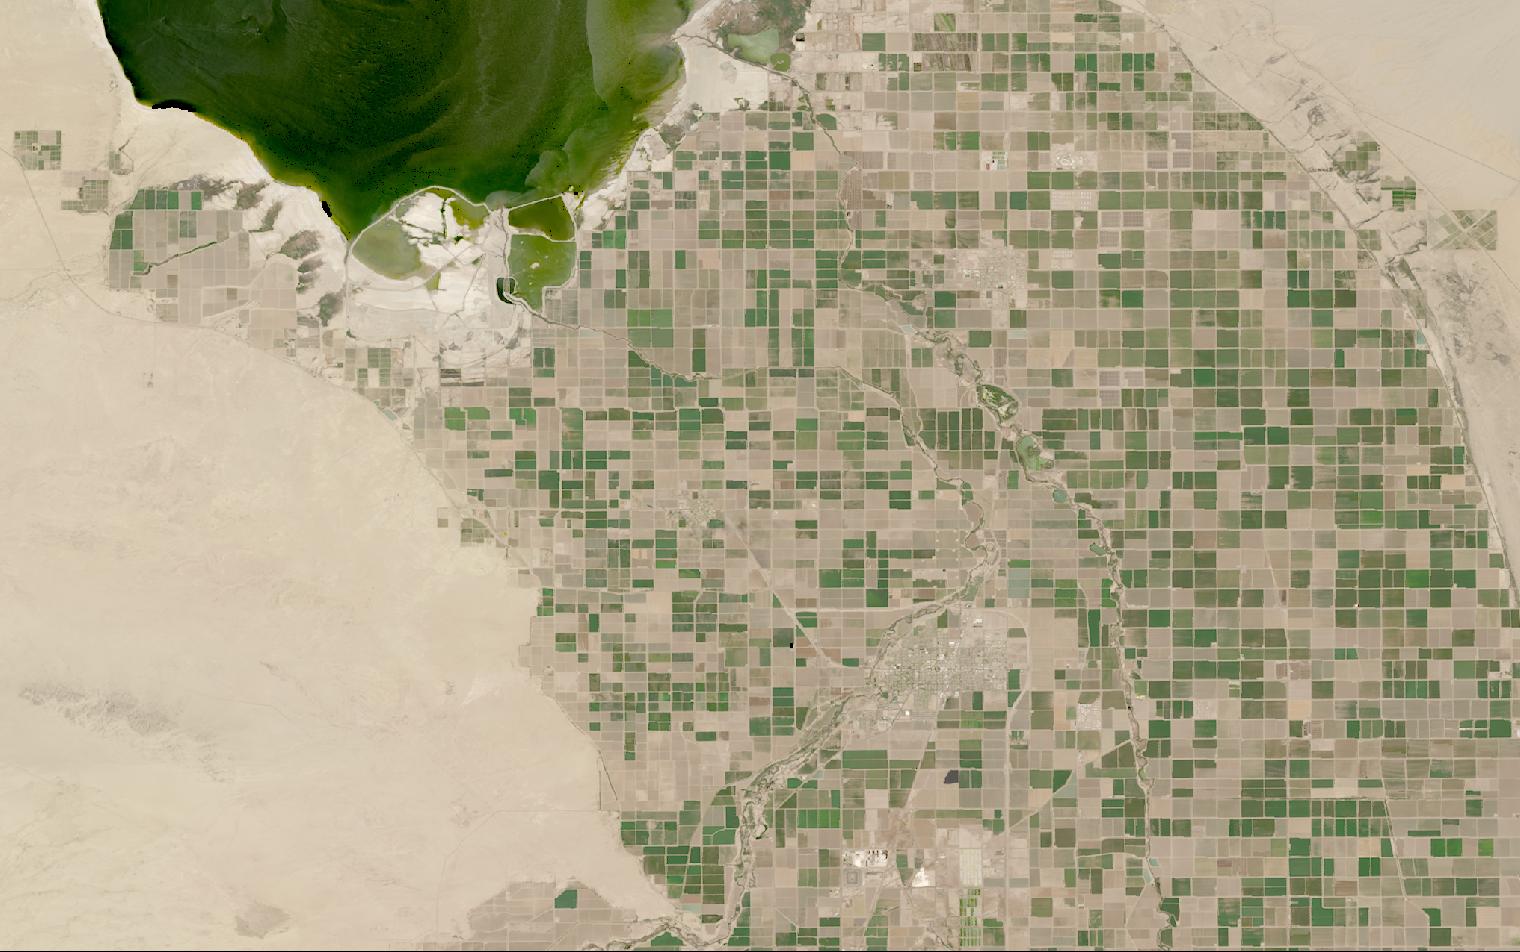
A gauge network samples a handful of fixed points across a watershed that ignores every administrative boundary.
Satellite data measures the same basin on every pass, giving direct, repeated observation.
This guide matches water resources tasks to the right data and provider, from accounting to compliance.
Table of Contents
Key takeaways
- Water resources programs depend on repeated, basin-wide measurement that no gauge network can reproduce on its own
- Evapotranspiration runs on free public data, but crop-level water stress needs a dedicated thermal satellite
- The shortlist narrows fast once you know whether you need consumption accounting or all-weather flood and reservoir extent
Before any provider enters the picture, a water resources program has to settle what it needs from the data itself. The summary below sets out the sensors, resolution, and cadence that operational water monitoring depends on.
| Primary sensors | Thermal infrared, multispectral optical, SAR |
|---|---|
| Working resolution | 30-70 m thermal, 10 m sharpened |
| Typical revisit | Daily to 1.5 days with paired thermal satellites |
| Core indices | Actual ET, land surface temperature, NDWI |
| Entry cost | Free with OpenET, or from $28 per month |
| Main constraint | Native thermal resolution rarely below 30 m |
Those figures cover the baseline that most water programs run on. Programs built around compliance reporting, irrigation accounting, or flood response shift both the sensor mix and the cost.
How satellite data is used in water resources
Satellite data enters water management at six distinct points, each pulling on a different sensor type and answering a different question about supply, consumption, or risk.
Evapotranspiration and consumption accounting
The hardest number in water management is not how much a canal delivers but how much a field, orchard, or landscape actually consumes through evapotranspiration. Ground measurement of that flux barely scales past a handful of research plots, so basin-wide accounting depends on satellites instead.
OpenET blends six independent, peer-reviewed evapotranspiration models against Landsat’s thermal and optical record, producing a free field-scale ensemble at 30 meters over the entire contiguous United States. It counts more than 13,000 registered users as of a December 2025 expansion announcement, and a modeled study the platform cites projects $127.5 million in savings and economic value for California almond growers over a five-year period.
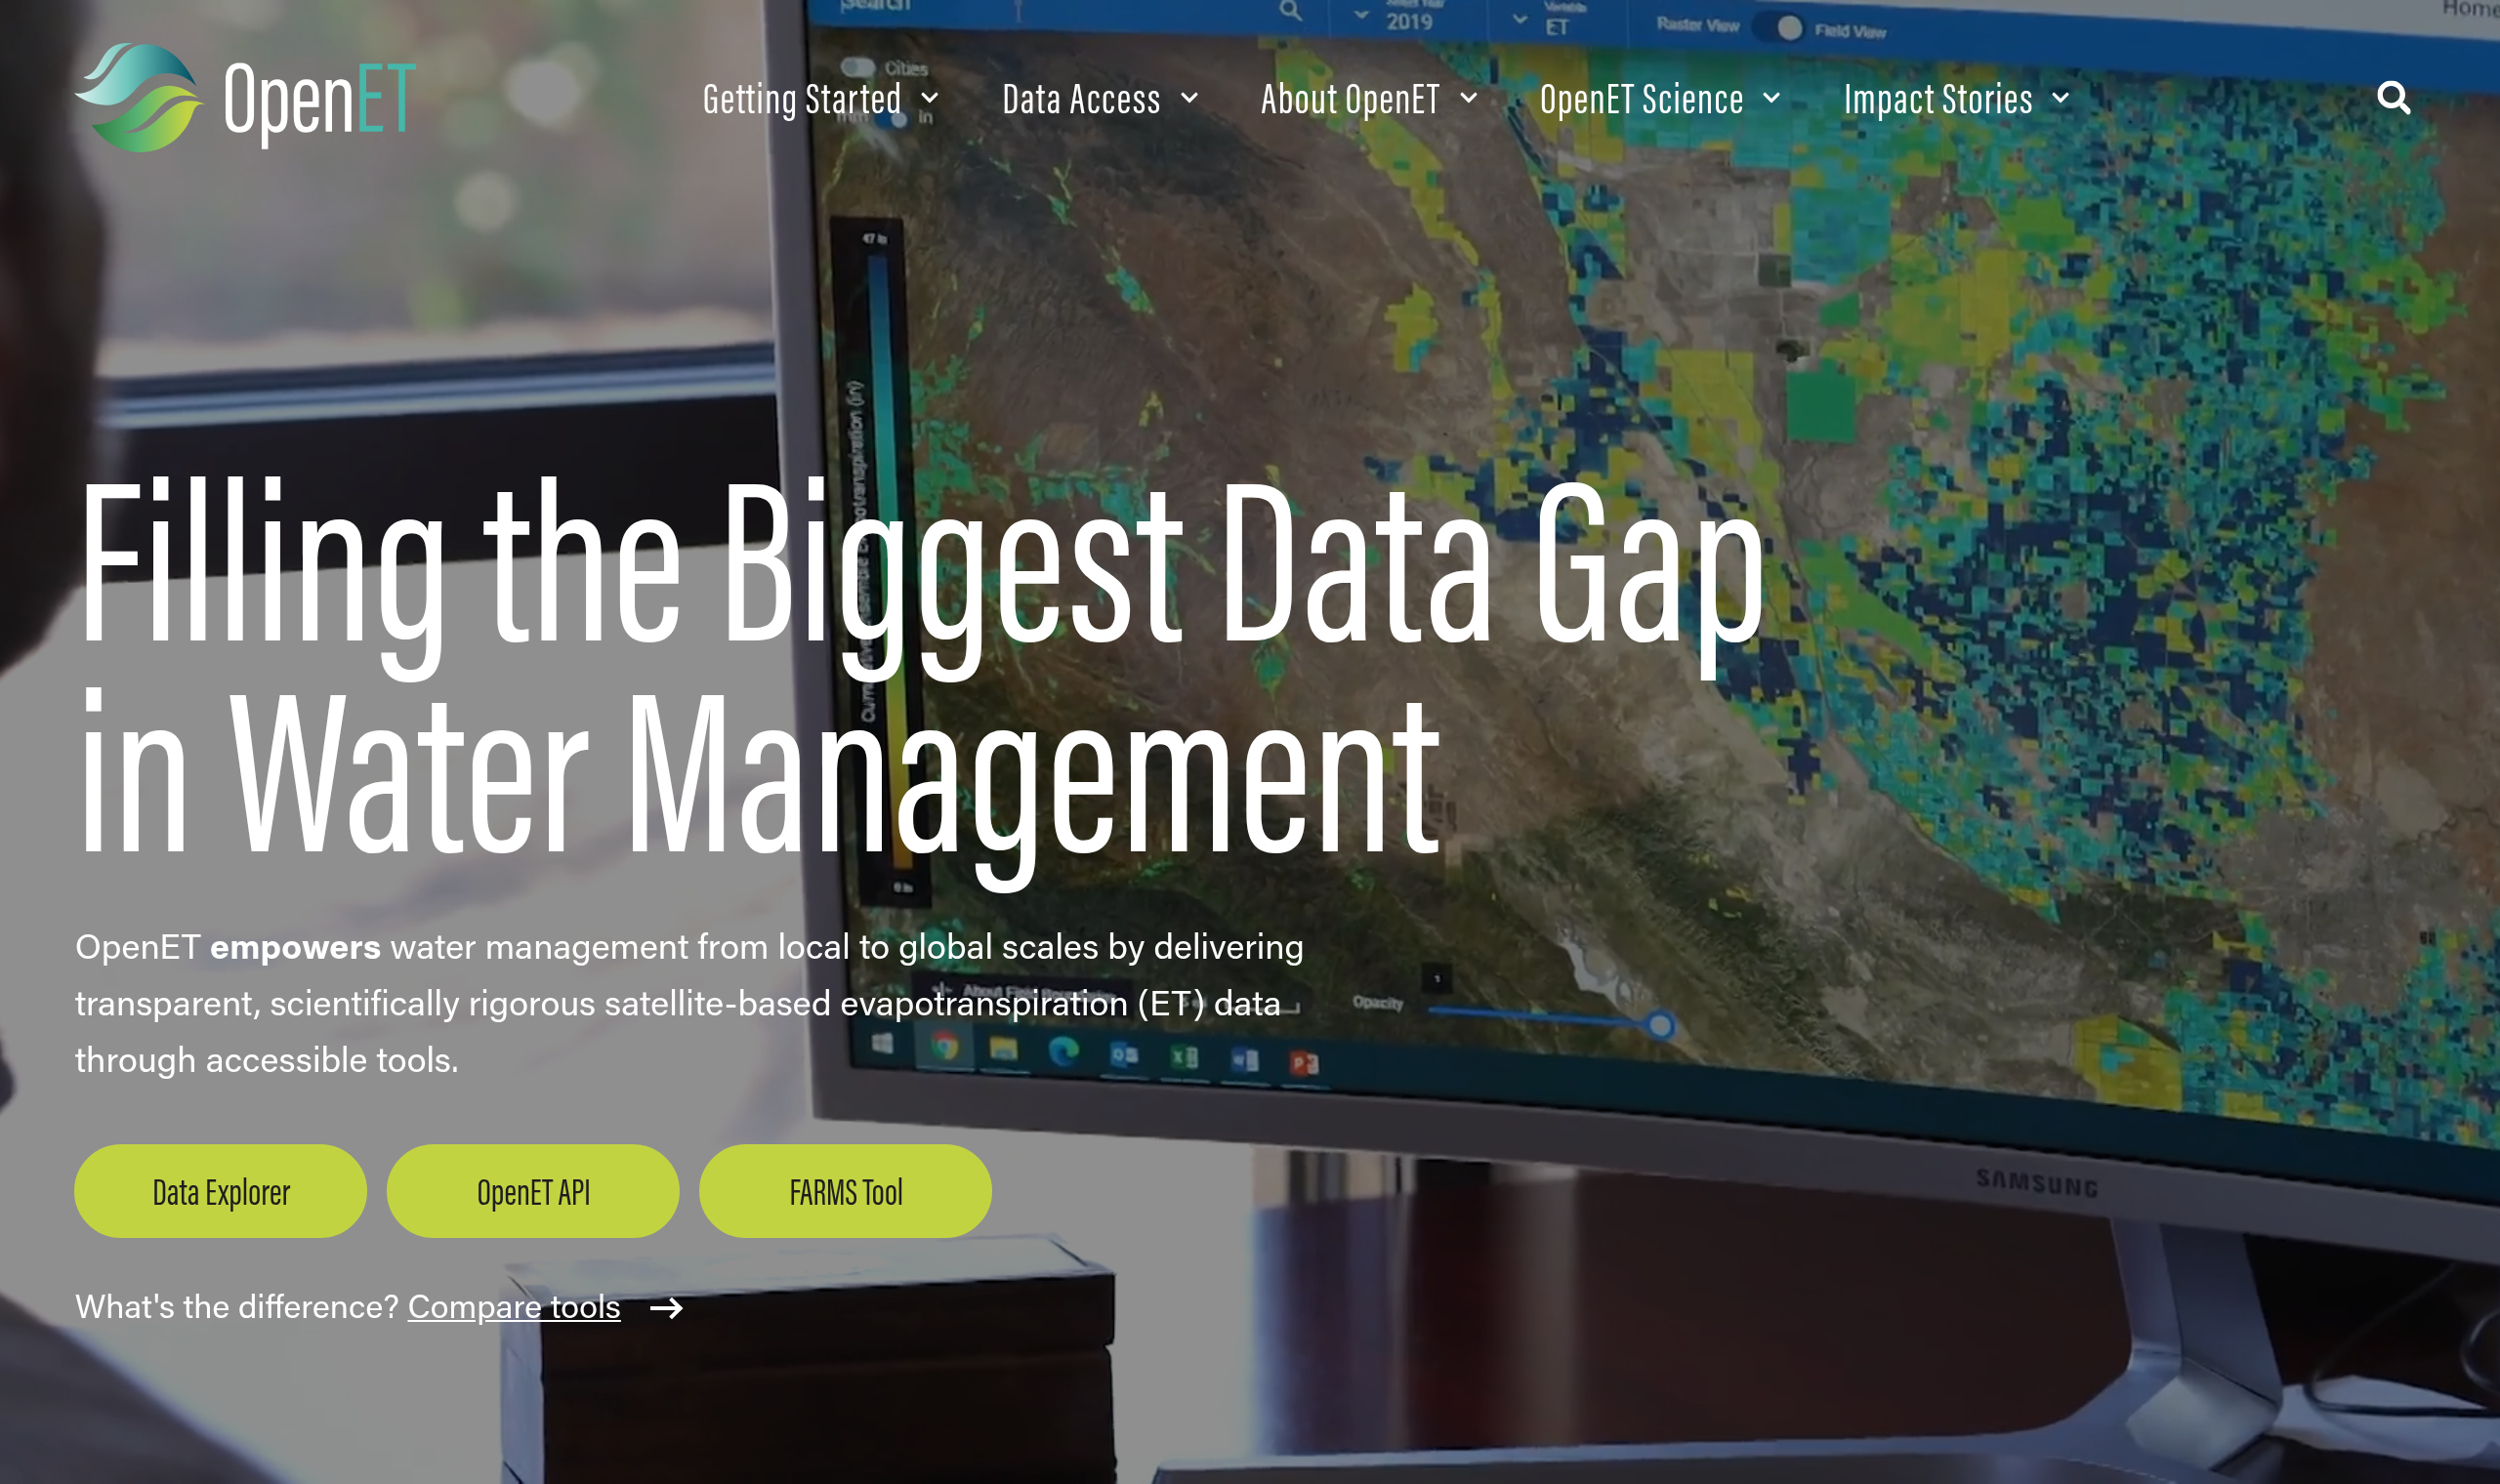
OpenET also supports California’s groundwater sustainability accounting, tallying how much a basin withdraws rather than measuring the ground itself. That distinction matters: when an aquifer empties faster than it recharges, the land above it can subside, a separate physical signal our guide to satellite data for subsidence monitoring covers through InSAR.
Compliance monitoring under the Water Framework Directive
The EU’s Water Framework Directive, Directive 2000/60/EC, commits member states to good status for every surface water body, with a target of good surface water status within 15 years of the directive’s entry into force on 22 December 2000, placing the original date at 22 December 2015. The same 15-year clock applies to groundwater bodies and to protected areas.
Extensions are capped at two further river basin management plan updates, run in six-year cycles, except where natural conditions make the objective impossible, and two additional cycles from that original date land on effectively 2027, a figure the directive never states outright.
None of that requires a satellite. A full-text search of the directive’s consolidated version returns zero hits for remote sensing, satellite, Earth observation, Copernicus, or aerial, and Annex V builds ecological status on biological quality elements sampled in the field, not from orbit.
That gap is exactly where satellite data earns its place. A river basin authority cannot field-sample every water body every month, and imagery covers the whole surface of a lake or reach rather than the single point a sampling crew can reach, screening the space between monitoring campaigns and flagging where a change warrants a site visit.
Crop and land water stress from thermal land surface temperature
A well-watered canopy transpires and stays cooler than the air around it, so land surface temperature is a proxy for water stress before a crop visibly wilts. That single physical fact underwrites an entire category of thermal satellite operators.
Hydrosat operates its own satellites, launched in 2024 and 2025, each carrying seven visible and near-infrared bands at 30 meters alongside two thermal bands at 70 meters, with an overpass near 10:30 in the morning or 1:30 in the afternoon. The thermal signal is sharpened against the collocated optical bands to deliver land surface temperature at 30 meters. Its own use cases name reservoir evaporation monitoring and drought detection directly, alongside water productivity mapping.
constellr runs a similar architecture from Europe: a cryocooled thermal sensor delivers 30-meter native land surface temperature, sharpened to 10 meters, with a 1.5-day average revisit and 1.0 to 1.5 K accuracy. Its stated use cases include crop water stress and evapotranspiration alongside irrigation efficiency and soil moisture proxies. The field-level side of the same measurement is covered in our guide to satellite data for agriculture.
Reservoir, lake, and surface water extent monitoring
Multispectral imagery separates water from land cleanly, because water absorbs near-infrared light that vegetation and bare soil reflect back, which is the basis for the index most extent-mapping tools run on. Tracked over time, that same index turns into a record of reservoir drawdown or lake shrinkage.
Planet’s near-daily optical constellation covers that baseline, and its Soil Water Content layer adds a second, complementary measurement: daily observations at 100 meters and 1 kilometer resolution, used in 17 countries to support drought-related programs for growers.
Sentinel Hub takes a different route to the same water bodies, providing API and web access to the open Sentinel-1 radar archive, live since 2014, plus the Copernicus Land Monitoring Service’s own water bodies dataset. Its own use cases list water resources monitoring and flood mapping outright.
Flood mapping and all-weather water extent
Heavy rain and cloud cover arrive together, which is exactly when an optical sensor goes blind to the water spreading beneath it. Radar solves that by emitting its own signal rather than reflecting sunlight, so it keeps imaging a flooding basin day or night, regardless of what is overhead.
ICEYE runs its X-band SAR constellation on daily to sub-daily revisit over a monitored area, defaults to an eight-hour delivery window from acquisition, and averages under four hours in practice. Building-level flood depth is among the named products in its natural catastrophe lineup, built on the same radar it uses for vessel detection and change monitoring.
Multi-sensor monitoring across a river basin
A program that tracks consumption, extent, and flood risk across one basin often ends up needing thermal, optical, and radar data at once, and sourcing all three from separate vendors means three contracts, three logins, and three support lines.
Sfera Technologies packages exactly that mix as a single commercial relationship, brokering optical, SAR, and thermal imagery from named third-party operators rather than operating satellites of its own. Its hyperspectral offering, sourced from a 31-band sensor at 5.3 meters, lists water monitoring among its own stated applications, alongside plant species differentiation.
What satellite data you need for water resources
Different water resources tasks call for different sensor modalities, resolutions, and revisit frequencies. The table below maps each common task to the data specifications it requires.
| Task | Sensor modality | Resolution | Revisit | Key index / band |
|---|---|---|---|---|
| Evapotranspiration accounting | Optical and thermal fusion | 30 m | 8 days | Actual ET |
| Groundwater and water-use accounting | Optical and thermal ensemble | 30 m | Monthly composite | ET, volumetric use |
| Crop and field water stress | Thermal infrared (LWIR) | 10-70 m | Daily to 1.5 days | Land surface temperature |
| Reservoir and lake extent | Multispectral optical | 3-10 m | Near-daily | NDWI |
| Basin-wide archive monitoring | Optical and SAR archive | 10-60 m | 5-12 days | NDWI, backscatter |
| Flood and surface water extent | SAR (X-band) | 0.5-27 m | Daily to sub-daily | Backscatter change |
| Ecological status screening | Multispectral optical | 10-30 m | Weekly to monthly | Turbidity proxy |
| Multi-sensor basin programs | Optical, SAR, thermal | Task-dependent | Task-dependent | Sensor-specific |
With data requirements mapped, the next step is identifying which providers can supply them. The section below covers the most relevant options for water resources programs, from a free accounting platform to satellite operators and a multi-source access point.
Satellite data providers for water resources
The providers below have documented water resources use cases and data products that map to the tasks in the table above. The mix spans data platforms, thermal operators, optical and radar satellite operators, and a multi-source access point.
| Provider | Type | Best for | Key water spec | Entry point |
|---|---|---|---|---|
| OpenET | Data platform | Free field-scale US ET data | Landsat ET at 30 m, 8-day revisit | Free within usage limits |
| Hydrosat | Thermal satellite operator | Reservoir evaporation and drought | 70 m native, 30 m sharpened LST | Quote, account-gated |
| constellr | Thermal operator | Crop water stress and ET proxies | 1.5-day revisit, 10 m sharpened | Quote or UP42 marketplace |
| Planet | Satellite operator | Near-daily optical, soil moisture | Soil Water Content at 100 m daily | Imagery from $2,700 per year |
| Sentinel Hub | Data platform | Water and flood mapping archive | Sentinel-1 SAR archive since 2014 | From $28 per month |
| ICEYE | SAR satellite operator | All-weather flood extent mapping | Building-level flood depth (SAR) | Quote or UP42 marketplace |
| Sfera Technologies | Multi-source access point | Multi-sensor water program access | Hyperspectral for water monitoring | From $4 per km² optical |
For a ranked shortlist focused on the thermal imagery that water programs increasingly add first, our guide to the best thermal satellite imagery providers covers the full market with head-to-head specifications.
How to choose satellite data for water resources
What I would separate carefully here is what the satellite measures and what the regulation asks. Compliance rests on in-situ sampling, and remote sensing adds spatial coverage between those points, so it complements the monitoring network rather than replacing it.
The first decision is what the number has to do. An irrigation district settling water rights needs defensible consumption accounting, not a picture, while a reservoir operator tracking drawdown needs extent and level captured over time.
Regulatory exposure narrows the field differently. Where a basin authority answers to a framework like the Water Framework Directive, satellite data plays a supporting role, flagging where a field visit is worth the trip rather than replacing the visit itself.
Geography decides the sensor mix. Optical and thermal instruments work well where clear skies are common, but a monsoon-driven flood or a persistently overcast basin needs SAR as the primary layer, not a backup, since radar is the only sensor type in this list unaffected by cloud.
Budget and cadence follow from what the program is actually watching. Continuous basin-wide accounting is cheaper on a subscription or a free public platform than on per-scene ordering, while a one-off reservoir survey suits per-square-kilometer or per-scene access without an annual commitment.
Data rights matter here in a way they do not for casual browsing. Verify whether your intended use, including regulatory submissions, public reporting, or resale to a client, is permitted under the provider’s standard commercial license before a program comes to depend on it.
Verdict
Water resources is the vertical where the free option is often the strongest one. Evapotranspiration accounting on public Landsat data is a solved, no-cost baseline for United States water management, and the picture changes only once a program needs faster revisit, all-weather coverage, or evidence for someone outside the organization.
Programs answerable to a framework like the Water Framework Directive should treat imagery as a screening layer over the in-situ sampling the rules actually require, not a substitute for it. Teams chasing crop or landscape water stress get the most from Hydrosat or constellr’s dedicated thermal satellites, and a basin authority tracking flood extent through cloud cover needs ICEYE’s all-weather SAR.
Programs that span accounting, thermal stress detection, and flood response draw on optical, thermal, and SAR data from different operators, and benefit from a single access point rather than managing three separate vendor relationships, the role Sfera Technologies plays for teams that want it. For a full ranked view of the thermal imagery market, see our thermal satellite imagery providers guide.
Frequently asked questions
Below are answers to the questions water resources buyers most commonly ask. Each answer points to the section where the full detail lives.
How is satellite data used in water resources management?
Satellite data covers six main workflows: evapotranspiration and consumption accounting, compliance screening under frameworks like the Water Framework Directive, thermal detection of crop and land water stress, reservoir and lake extent tracking, all-weather flood mapping, and multi-sensor basin programs that combine several of those layers. The detail is in “How satellite data is used in water resources“.
Does the Water Framework Directive require satellite monitoring?
No. The directive’s text names in-situ biological sampling for ecological status and never mentions remote sensing, satellites, or Earth observation, so imagery works as a screening tool between monitoring campaigns, not a compliance substitute. The framework and its honest limits are covered in “How satellite data is used in water resources“.
Can satellite data measure evapotranspiration and water use?
Yes. A multi-model ensemble blends Landsat thermal and optical data into field-scale actual evapotranspiration at 30 meters, the number water accounting and irrigation decisions run on, and one public platform delivers it free within usage limits. The approach is described in “How satellite data is used in water resources“.
What resolution do I need for water resources monitoring?
Routine evapotranspiration and land surface temperature work at 30 to 70 meters, reservoir and lake extent tracking wants 3 to 10 meter optical, and flood mapping runs on SAR from sub-meter tasked scenes up to wide-area scans covering hundreds of kilometers. The full task-to-resolution mapping is in “What satellite data you need for water resources“.
Which satellite data providers are best for water resources?
OpenET is the strongest free option for United States evapotranspiration accounting, Hydrosat and constellr lead on dedicated thermal land surface temperature, ICEYE covers all-weather flood extent by SAR, and Sentinel Hub is the cheapest route into the open Sentinel archive. Provider details and access models are in “Satellite data providers for water resources“.
How do satellites monitor floods and surface water through cloud cover?
Radar emits its own signal and reads through cloud and darkness, so an X-band SAR constellation keeps imaging a flooding basin exactly when optical sensors go blind to the event they need to see. The trade-off is that SAR shows backscatter change rather than a photograph, and sensor choice by geography is discussed in “How to choose satellite data for water resources“.

My passions are Earth Observation and Satellites, and my profession is Data Analysis. I combine both within ObservationData.com to show you the use cases of Earth Observation, to help you find the right provider, and to share your experiences.
