
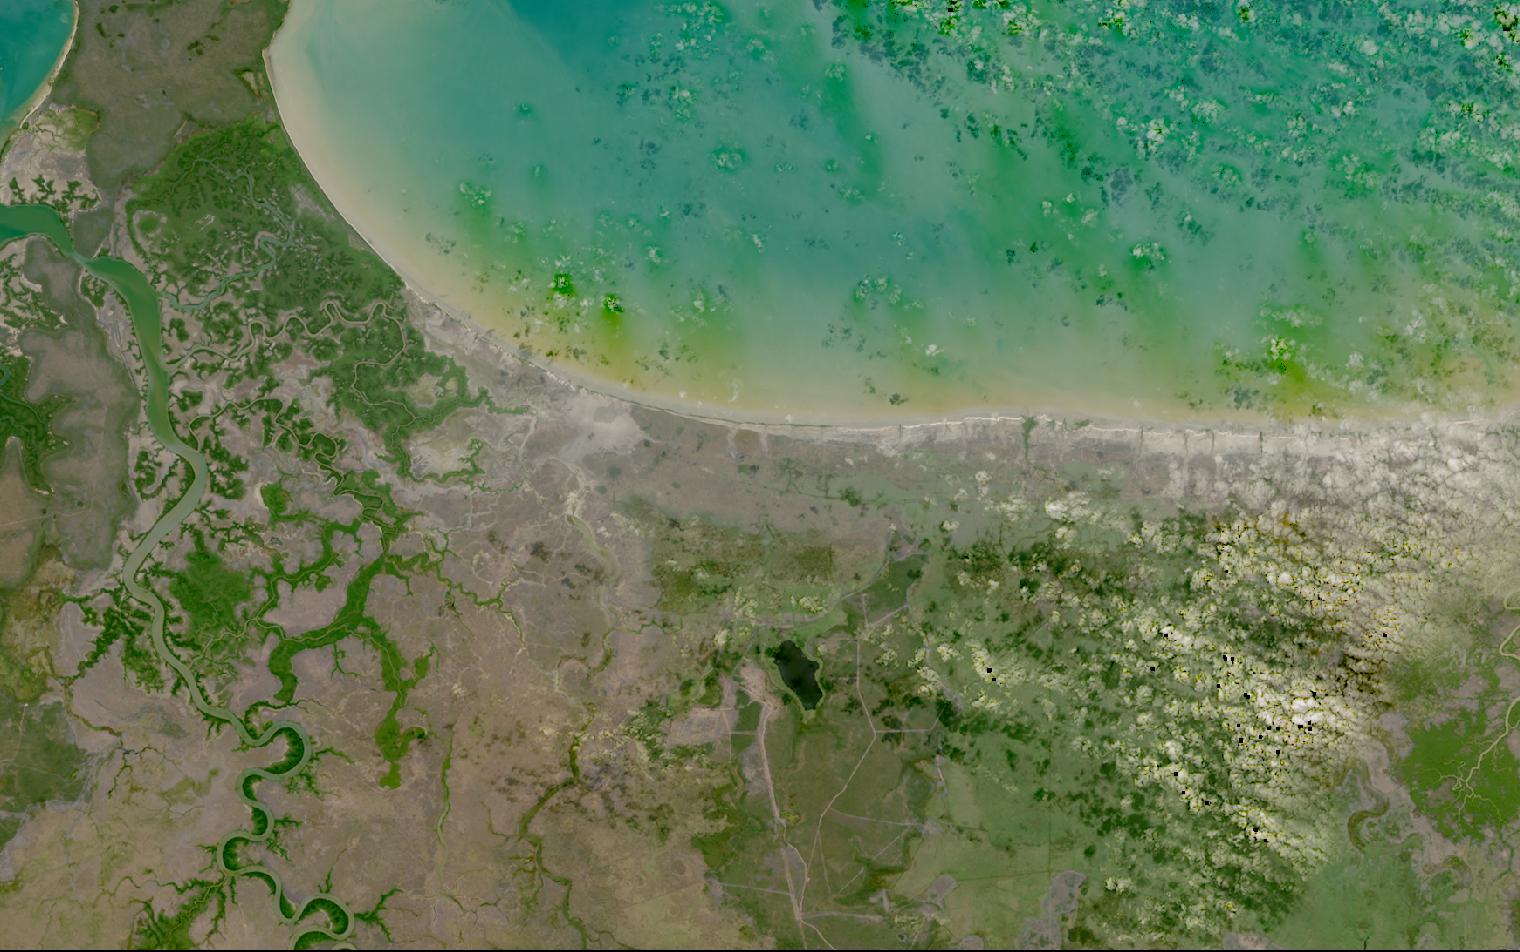
Carbon claims and deforestation-free sourcing need evidence across supply chains too large for site audits alone.
Satellite data repeats the same independent measurement, and reaches back over decades.
This guide matches sustainability tasks to the right data and provider, from carbon accounting to disclosure.
Table of Contents
Key takeaways
- Sustainability disclosure increasingly runs on evidence a third party can check, not on self-reported figures alone
- Carbon and methane accounting share the same starting point: measuring radiance, not the emission itself
- The shortlist narrows fast once you know whether you need a biomass baseline or facility-level methane data
Before any provider enters the picture, a sustainability program has to settle what it needs from the data itself. The summary below sets out the sensors, resolution, and cadence that most environmental monitoring depends on.
| Primary sensors | Multispectral optical, hyperspectral, SAR |
|---|---|
| Working resolution | 10-30 m biomass, 30 m methane/CO2 |
| Typical revisit | Annual archives, near-daily optical |
| Core indices | Aboveground biomass, CH4/CO2 concentration |
| Entry cost | Free with Carbon Mapper, or from $2,700 per year |
| Main constraint | Measures radiance, not emissions directly |
Those figures cover the baseline that most sustainability programs draw on. Programs chasing a specific gas, a carbon rating, or a verified disclosure figure push both the sensor mix and the cost in a different direction.
How satellite data is used in sustainability
Satellite data feeds into sustainability programs at several distinct points, each drawing on a different sensor type and handing a different kind of evidence to reporting teams, investors, and supply chain managers.
Corporate carbon disclosure and the CSRD
The EU’s Corporate Sustainability Reporting Directive, Directive (EU) 2022/2464, sets out how companies disclose environmental performance, and the Council of the EU narrowed its reach with the Omnibus I package, adopted 24 February 2026. The directive now applies to companies with more than 1,000 employees and above €450 million in net annual turnover, with a separate turnover test for groups headquartered outside the EU.
Companies that began reporting from financial year 2024 under the earlier rules get a transition exemption, falling out of scope for 2025 and 2026 under the revised thresholds. None of this tells a reporting team how to produce its numbers. The directive itself requires disclosure, not a measurement method, and satellite-derived biomass, deforestation, and methane data are one of several ways to back a sustainability claim with evidence a third party can check.
Forest and land carbon stock measurement
Carbon programs and disclosure filings alike need a number, not a map of change. Aboveground biomass converts canopy structure into tonnes of carbon per hectare, and optical imagery alone cannot see that structure, so credible products fuse it with spaceborne and airborne lidar that measures canopy height directly.
Chloris Geospatial publishes annual biomass stock and biomass change maps from the year 2000 onwards at 30 m, with 10 m products available, giving a disclosure team a baseline that was not invented at the project’s start.
Sylvera takes a related approach through its Biomass Atlas, combining terrestrial, airborne, and drone-based laser scanning into a 30 m biomass and canopy height product, and reports errors below 9 percent at typical project scale. Neither company operates satellites itself, which is the norm in this segment: the value sits in the model and the calibration data.
Deforestation-linked supply chain risk
Companies reporting Scope 3 emissions or sourcing forest-risk commodities need to show their supply chain is not driving deforestation, a question no single site audit can answer at the scale of a global sourcing network. Where the EU Deforestation Regulation applies, the plot-level obligations are set out in our guide to satellite data for forestry.
Satelligence builds its deforestation and supply chain alerts on Sentinel-2 optical and Sentinel-1 radar, using the radar record to keep monitoring continuous through the cloud cover that hides fresh clearings in the tropics. Its platform carries EY ISAE 3000 and ISO 27001 certification, aimed at giving a sustainability team an audit-ready evidence trail rather than a raw satellite feed.
Methane and greenhouse gas verification
Methane is the fastest-acting greenhouse gas a company can be asked to account for, and dedicated satellites now resolve it down to individual industrial facilities rather than national averages.
Tanager-1, the hyperspectral satellite behind Carbon Mapper’s methane program, is built and operated by Planet around an instrument NASA’s Jet Propulsion Laboratory designed. Carbon Mapper leads the coalition and releases the resulting plume data free for non-commercial use, at 30 m resolution with a 90 percent probability of detection between 90 and 180 kg of methane per hour.
Kayrros takes a different route, owning no satellites and instead fusing data from more than 20 third-party constellations. Its Methane Watch platform is, in the company’s own words, the monitoring platform of choice for regulators including the International Methane Emissions Observatory and the US government, and it reports satellite-derived methane readings that typically run two to ten times larger than what companies self-report.
Portfolio-level ESG and physical risk monitoring
Once a company’s own emissions and land footprint are under control, the next question is what physical climate risk sits inside an investment portfolio, a problem that scales with the size of the holdings rather than any single site.
Kayrros extends its multi-constellation analytics to this question too, running a Wildfire Risk Monitor for investors and insurers and a Nature Impact Platform that gives financial institutions biodiversity intelligence tied to specific holdings.
Planet’s near-daily PlanetScope archive covers similar ground from the operator side, and its Planetary Variables line, including the Forest Carbon Diligence layer at 30 m resolution, lists sustainability reporting and supply chain ESG explicitly among its own stated use cases.
What satellite data cannot verify
A satellite does not measure an emission. It measures reflected or emitted radiation, and every methane figure, biomass estimate, or land cover class in this guide is a model built on top of that radiance, not a direct count of molecules or tonnes.
That gap matters in three places. A Scope 1 methane plume below a sensor’s detection floor is invisible, not zero. Scope 3 supply chains, spread across thousands of smallholder farms and subcontractors, are largely out of reach from orbit beyond the land-cover layer they sit on. And a biomass or carbon assessment, however well validated, is evidence to support a ground inventory, not a replacement for one.
What satellite data you need for sustainability
Different sustainability tasks call for different sensor modalities, resolutions, and revisit frequencies. The table below maps each common task to the data specifications it requires.
| Task | Sensor modality | Resolution | Revisit | Key index / band |
|---|---|---|---|---|
| Carbon disclosure evidence | Optical and LiDAR fusion | 10-30 m | Annual | AGB, biomass change |
| Forest and land carbon rating | Optical, terrestrial and airborne LiDAR | 30 m | Annual | Canopy height, AGB |
| Deforestation-linked sourcing risk | SAR and multispectral optical | 10 m | 5-6 days | NDVI change, backscatter |
| Facility-level methane detection | Hyperspectral (VNIR-SWIR) | 30 m | Weekly | CH4 column concentration |
| Independent methane cross-check | Multi-sensor fusion | Varies by sensor | ~2-day average | Emission rate estimate |
| Portfolio physical risk scoring | Multispectral optical, historical archive | 3-10 m | Seasonal to annual | Risk or anomaly index |
| Biodiversity and nature screening | Multispectral optical | 10 m | Annual | Land cover class, NDVI |
With the data requirements mapped, the next step is identifying which providers can supply them. The section below covers the most relevant options for sustainability programs, from biomass analytics to methane verification and portfolio risk monitoring.
Satellite data providers for sustainability
The providers below have documented sustainability use cases and data products that map to the tasks in the table above. The mix spans nonprofit and commercial data providers, analytics platforms, and a satellite operator.
| Provider | Type | Best for | Key sustainability spec | Entry point |
|---|---|---|---|---|
| Chloris Geospatial | Analytics platform | Forest carbon disclosure data | Annual biomass since 2000, 30 m | From $5,000 per year |
| Sylvera | Analytics platform | Carbon credit quality ratings | Biomass errors below 9% at 30 m | Free tier, then demo request |
| Satelligence | Analytics platform | EUDR and CSRD supply-chain risk | Sentinel-1/2 fusion, 10 m optical | Demo request |
| Carbon Mapper | Nonprofit data provider | Independent methane and CO2 data | 30 m, 90-180 kg/hr methane PoD | Free for non-commercial use |
| Kayrros | Analytics platform | ESG risk and methane analytics | 20+ satellite constellations fused | Demo request |
| Planet | Satellite operator | Forest carbon and ESG monitoring | Forest Carbon Diligence at 30 m | Imagery from $2,700 per year |
For a ranked shortlist of imagery operators and analytics platforms across the wider market, our guide to the best satellite imagery providers covers head-to-head specifications beyond the six providers shortlisted here.
How to choose satellite data for sustainability
The first decision is what the data has to prove. A biomass baseline for a disclosure filing, a carbon rating for an investor, and a facility-level emissions figure are three different products built from different inputs, and a vendor strong at one is rarely the cheapest route to another.
Regulatory exposure sets the second cut. The CSRD does not name satellite data as a requirement, but a company inside its narrowed scope still needs disclosure figures a third party can check, and that pushes toward providers who publish a defensible methodology and validation record rather than a closed black box.
Geography decides the sensor mix, much as it does in forestry and land monitoring more broadly. Optical archives work well where clear skies are common, but tropical supply chains need radar in the mix to keep a record continuous through persistent cloud cover.
Budget and scope follow from what is being monitored. A single facility’s methane output or one portfolio’s wildfire exposure is affordable on a demo or quote basis, while a multi-year disclosure program spanning a whole supply chain is cheaper on an annual subscription than on repeated one-off orders.
Data rights matter more here than in most verticals. Verify whether your intended use, including public disclosure, regulatory submission, and third-party audit of the underlying data, is permitted under a provider’s standard commercial license before building a reporting cycle around a single source.
Verdict
Sustainability is the vertical where the proof burden falls on the buyer, not the regulation. The CSRD and its Omnibus I revision narrowed who must report, but neither one specifies how, which leaves the choice of evidence to the reporting company itself.
Teams building a forest carbon baseline should evaluate Chloris Geospatial and Sylvera first, since both reach back to a validated biomass record rather than a single-year snapshot. Companies tracking deforestation-linked sourcing need Satelligence’s audit-ready supply chain monitoring, and methane accounting has two credible routes, a free one through Carbon Mapper and a subscription one through Kayrros.
Programs spanning disclosure evidence, supply chain risk, and portfolio-level physical risk draw on biomass, radar, and hyperspectral data from different vendors, and rarely settle for one source once the full reporting cycle is in view. For the operators and platforms covering the wider imagery market, see our satellite imagery providers guide.
Frequently asked questions
Below are answers to the questions sustainability data buyers most commonly ask. Each answer points to the section where the full detail lives.
How is satellite data used in sustainability reporting?
Satellite data supports five workflows: corporate carbon disclosure, forest and land carbon stock measurement, deforestation-linked supply chain risk, methane and greenhouse gas verification, and portfolio-level ESG and physical risk monitoring. Each one draws on a different sensor type. The detail is in “How satellite data is used in sustainability“.
Does the CSRD require companies to use satellite data?
No, the directive requires disclosure, not a measurement method, even after the Omnibus I package narrowed its scope in February 2026. Satellite-derived biomass, deforestation, and methane data are one of several ways to back a claim with independently checkable evidence. The regulatory detail is in “How satellite data is used in sustainability“.
Can satellites measure a company’s carbon emissions directly?
Not directly. A satellite measures reflected or emitted radiation, and every methane figure or biomass estimate in this guide is a model built on that radiance, not a direct count of molecules or tonnes. What that gap means in practice is covered in “How satellite data is used in sustainability“.
What is the difference between a biomass baseline and a carbon rating?
A biomass baseline, the kind Chloris Geospatial publishes, estimates tonnes of carbon stored in a landscape from satellite and lidar data. A carbon rating, Sylvera’s core product, grades the credibility of a specific carbon credit project against that kind of evidence and field data. Both approaches are covered in “How satellite data is used in sustainability“.
Which satellite data providers are best for sustainability?
Chloris Geospatial and Sylvera lead on forest carbon baselines and ratings, Satelligence covers deforestation-linked supply chain risk, and Carbon Mapper and Kayrros both verify methane, one free and one subscription-based. Planet’s near-daily archive and Forest Carbon Diligence layer round out portfolio-level monitoring. Provider details and access models are in “Satellite data providers for sustainability“.
Can satellite data verify Scope 3 supply chain claims?
Only partially. Satellite data can show whether the land behind a supply chain is being cleared or degraded, which is exactly what Satelligence’s monitoring targets, but it cannot see the thousands of individual transactions a full Scope 3 claim rests on. The limits of that evidence are discussed in “How satellite data is used in sustainability“.

My passions are Earth Observation and Satellites, and my profession is Data Analysis. I combine both within ObservationData.com to show you the use cases of Earth Observation, to help you find the right provider, and to share your experiences.
