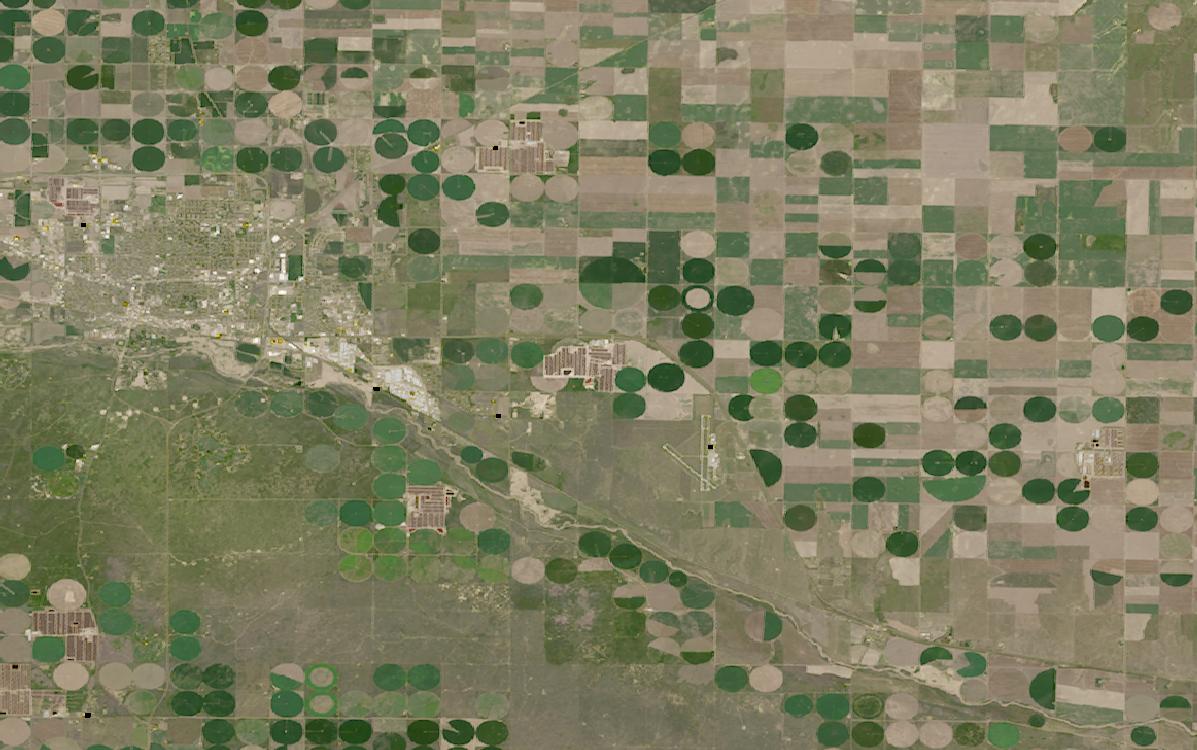
Field conditions change faster than crews can visit, leaving gaps in crop health visibility.
Satellite imagery closes that gap, tracking vegetation stress and soil moisture without field access.
This guide matches agriculture tasks to the right data and provider, from irrigation to yield.
Table of Contents
Key takeaways
- Agriculture programs depend on repeatable multispectral coverage that no ground-based monitoring program can match at field scale
- Crop health runs on Red Edge and NIR, but a complete program also needs SAR or thermal for soil moisture and evapotranspiration
- The shortlist narrows fast once you know whether you need finished agronomy analytics or raw imagery your team processes in-house
Before any provider enters the picture, an agriculture program has to settle what it needs from the data itself. The summary below sets out the sensors, resolution, and cadence that field-scale crop monitoring depends on.
| Primary sensors | Multispectral optical, thermal infrared, SAR |
|---|---|
| Working resolution | 3-10 m for field-scale monitoring |
| Typical revisit | Weekly through the growing season |
| Core indices | NDVI, NDRE, CIRE, LST |
| Entry cost | Free with Sentinel-2, or from $28 per month |
| Main constraint | Cloud cover breaks the optical time series |
Those figures cover the baseline that most row-crop programs run on. Programs that depart from it, through irrigation scheduling, cloud-heavy geographies, or sub-meter boundary work, change both the sensor mix and the cost.
How satellite data is used in agriculture
Satellite data enters agriculture programs at six distinct workflow stages, each relying on different sensor types and delivering different forms of decision support to agronomists, farm managers, and food-system analysts.
Crop health and vegetation monitoring
The most widespread agricultural application is tracking crop vigor and stress using vegetation indices derived from multispectral imagery. NDVI (Normalized Difference Vegetation Index) and its variants use the contrast between red-light absorption and NIR reflectance to quantify photosynthetic activity. The Red Edge band, available on sensors like the 8-band SuperDove and EOSDA’s EOS SAT-1, adds sensitivity to early-stage chlorophyll changes that standard NDVI misses until stress becomes visible to the eye.
At 3-10 m resolution and weekly revisit, multispectral monitoring detects within-field variability that triggers targeted intervention rather than whole-field treatment.
Yield estimation and harvest forecasting
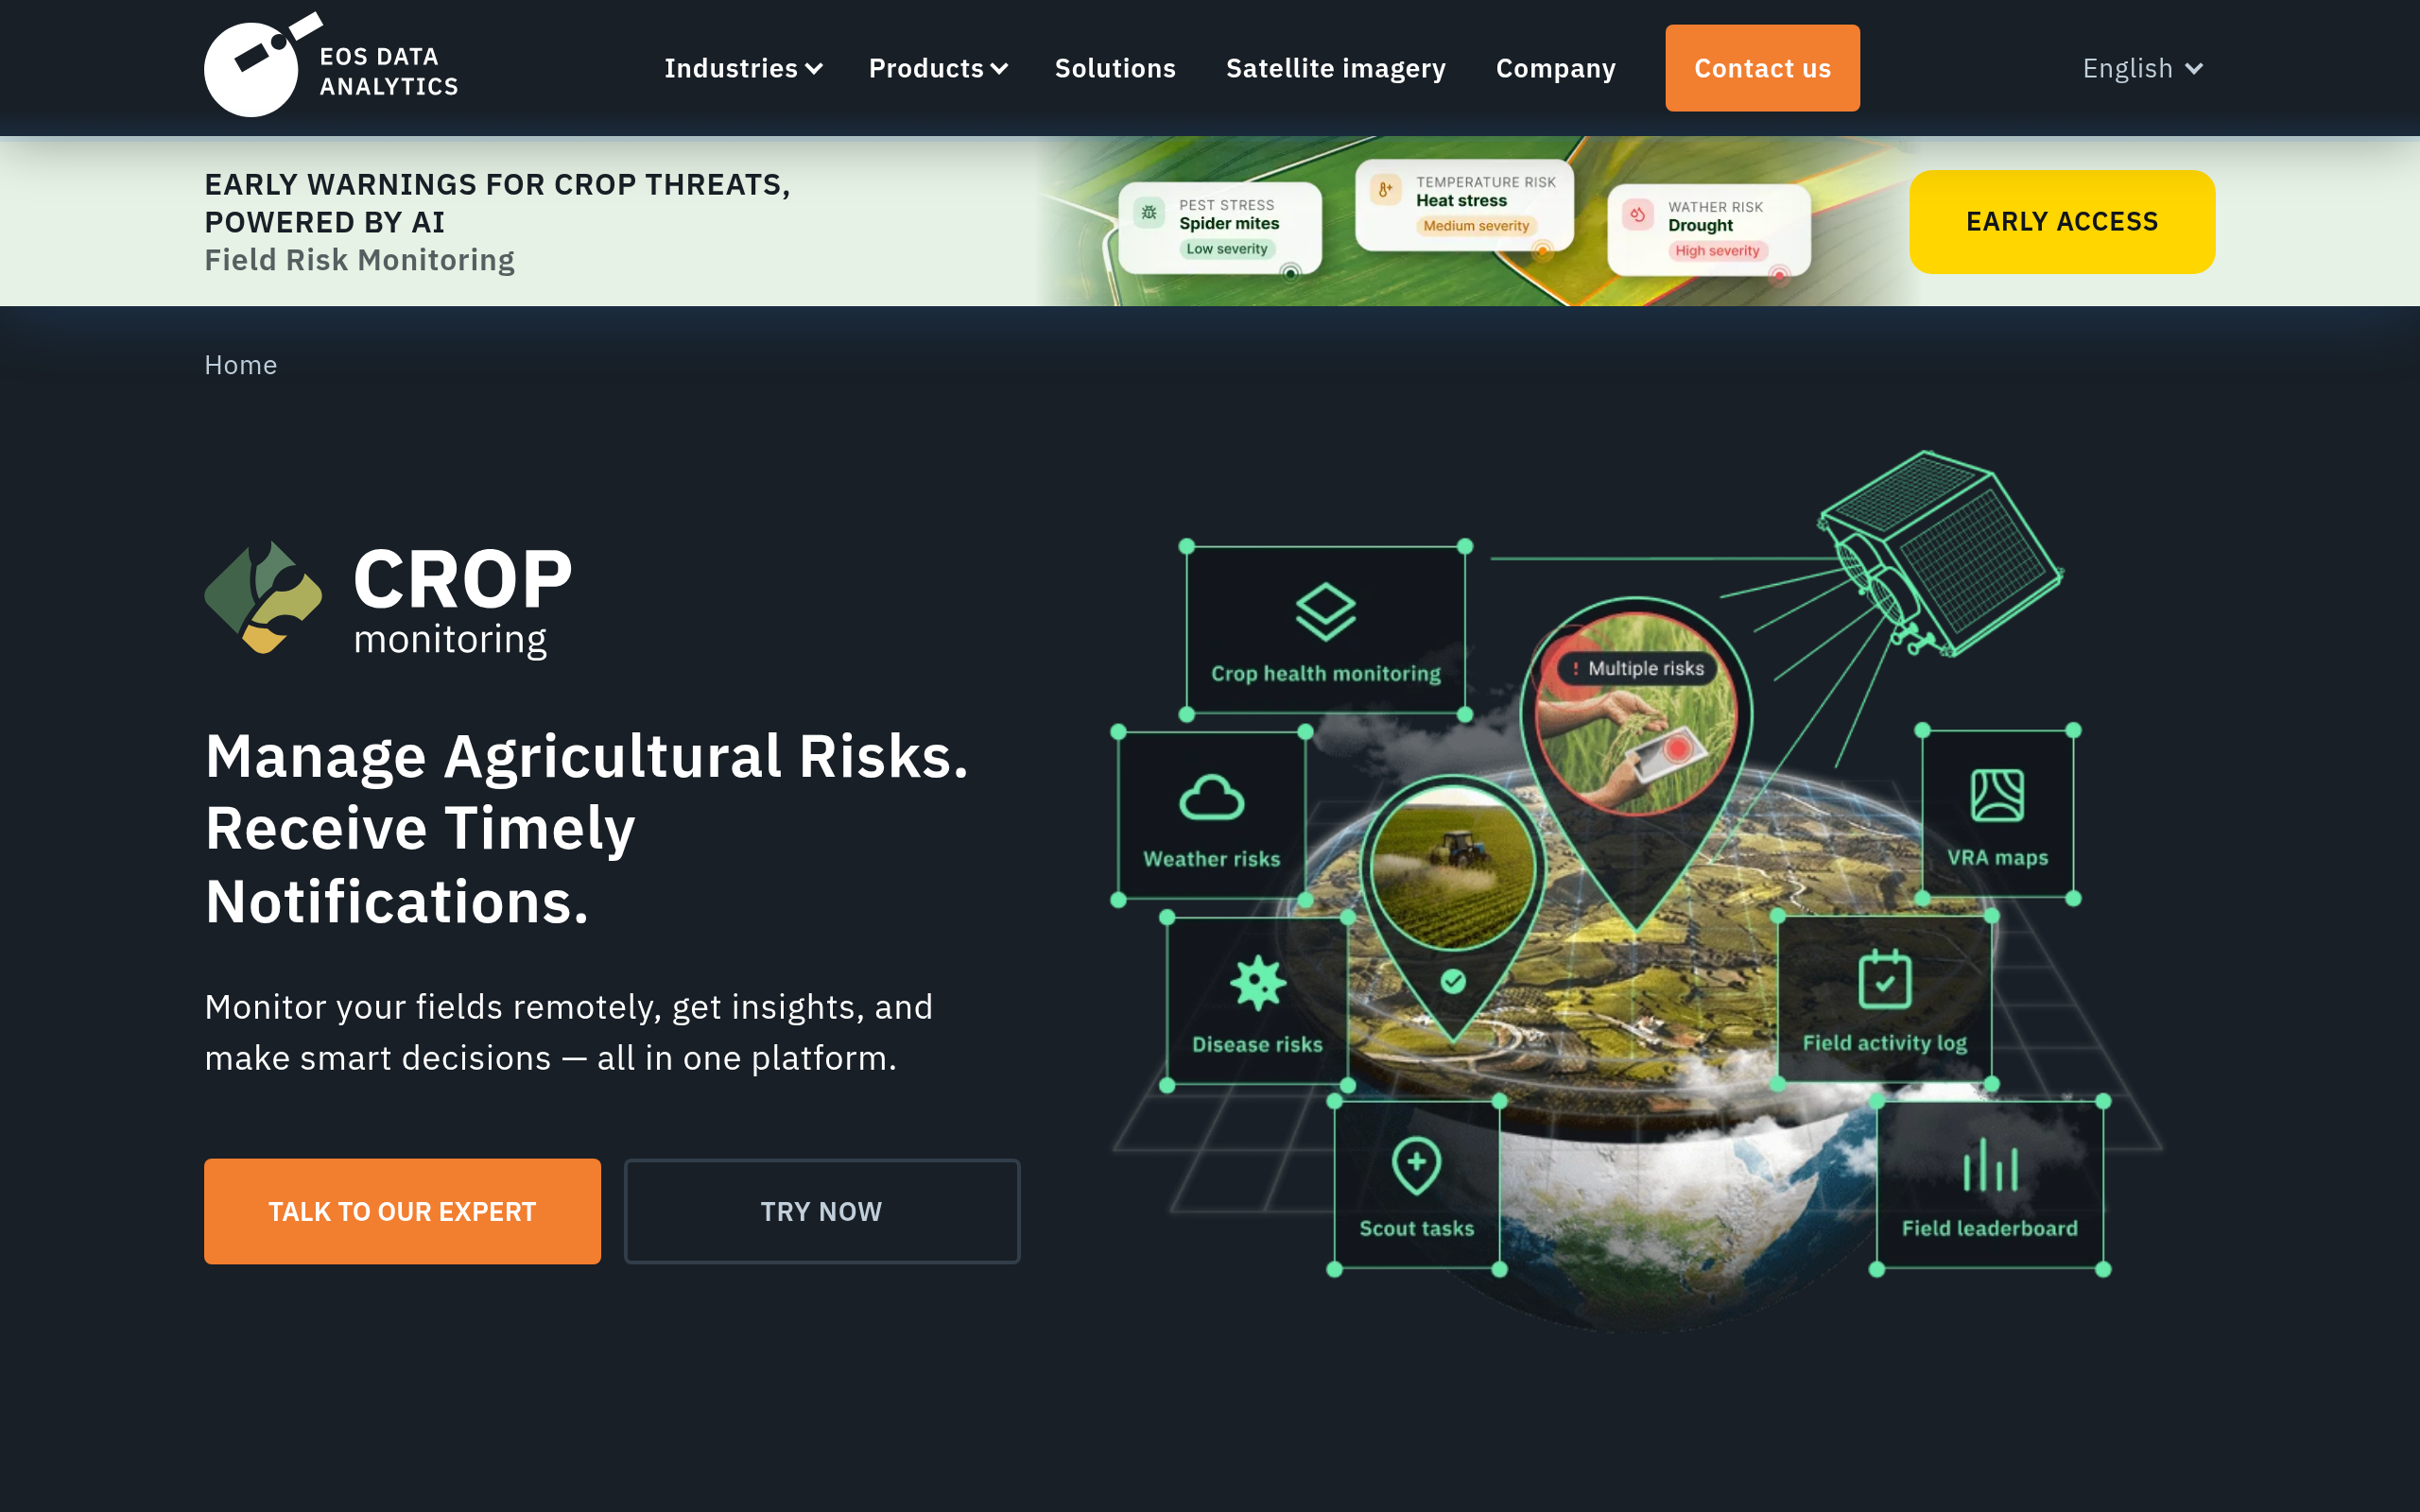
Cumulative vegetation index time series through a growing season correlate with final grain or fruit yield, and machine-learning models trained on historical imagery and ground-truth yield data can generate field-level forecasts weeks before harvest. EOS Data Analytics’ EOSDA Crop Monitoring platform delivers yield prediction using biophysical and ML models across multiple crops.
Planet’s Planetary Variables product line includes a Crop Biomass layer at 3 m and 10 m resolution, delivered as a daily cloud-free raster that fuses optical and radar inputs. EarthDaily’s crop intelligence products are live on the Bloomberg Terminal, serving commodity traders and food-security analysts who need early-season production signals.
Irrigation management and soil moisture
Thermal infrared imagery directly measures Land Surface Temperature (LST), which is the primary satellite proxy for crop evapotranspiration and water stress. When a canopy is transpiring well, it stays cooler than the air. Thermal anomalies indicate water deficit before visible wilting occurs. constellr’s HiVE constellation delivers LST at 30 m native resolution and down to 10 m with the LSTzoom product, with a 1.5-day revisit and 1.0-1.5 K absolute accuracy.
SAR-derived and model-based soil moisture products from EOSDA (SMAP at 250 m, AMSR at 100 m) complement thermal data for root-zone moisture estimation, giving irrigation managers both surface and canopy-level signals in a single workflow.
Field boundary and zone mapping
Accurate field boundaries are the geographic foundation of any per-field analytics program. High-resolution optical imagery at sub-2 m, combined with automated segmentation algorithms, extracts parcel boundaries with sufficient accuracy for subsidy compliance, prescription mapping, and insurance underwriting. Resolution is not the only route to a parcel map: Planet’s Field Boundaries Planetary Variable delineates fields globally from monthly Sentinel-2 composites at 10 m, trading edge precision for coverage and cost.
Zone mapping within fields, distinguishing management zones by soil type or historical yield variability, uses multispectral imagery at 1-5 m resolution to drive variable-rate application planning.
Pest, disease, and anomaly detection
Fungal infection, insect infestation, and nutrient deficiency each leave spectral signatures in NIR and Red Edge reflectance before physical damage spreads. Multispectral time-series monitoring catches localized anomalies within fields that deviate from expected seasonal trajectories, triggering early scouting dispatch to confirm and treat. At near-daily revisit intervals, the time window between anomaly detection and actionable ground response compresses from weeks to days, reducing crop loss and treatment cost.
In-season variable-rate application
Prescription maps for fertilizer, pesticide, or irrigation that vary application rate across a field are derived from within-field NDVI or Red Edge variation maps captured at the start of a treatment window. At 1-3 m resolution, multispectral imagery resolves application zones at the precision required for variable-rate equipment.
EOSDA Crop Monitoring delivers VRA prescription maps as an in-platform output. The same imagery, captured repeatedly through the season, allows post-application performance tracking to close the agronomic feedback loop.
What satellite data you need for agriculture
Different agricultural tasks require different sensor modalities, resolutions, and revisit frequencies. The table below maps each common task to the data specifications it requires.
| Task | Sensor modality | Resolution | Revisit | Key index / band |
|---|---|---|---|---|
| Crop health monitoring | Multispectral optical | 3-10 m | Weekly or better | NDVI, Red Edge, NDRE |
| Early stress detection | Multispectral optical (Red Edge required) | 3-5 m | Weekly | Red Edge, NDRE, CIRE |
| Yield estimation | Multispectral optical (time series) | 3-10 m | Bi-weekly through season | NDVI cumulative, LAI, NDWI |
| Soil moisture (surface) | SAR (C-band) or derived SMAP/AMSR products | 100-500 m | 1-3 days | Backscatter ratio, SMDI |
| Crop water stress / evapotranspiration | Thermal infrared (LWIR) | 10-100 m | Daily to 1.5-day | LST, CWSI |
| Field boundary mapping | High-resolution optical | 0.5-3 m | Annual or per-season | NDVI edge detection, parcel segmentation |
| Within-field zone mapping | Multispectral optical | 1-5 m | Per-season | NDVI variance, NDRE spatial pattern |
| Pest and disease anomaly detection | Multispectral optical (Red Edge + NIR) | 1-5 m | Weekly or better | Red Edge ratio, NDRE deviation |
| All-weather crop monitoring | SAR (C-band or L-band) | 3-20 m | 6-12 days | Backscatter intensity, interferometric coherence |
| VRA prescription mapping | Multispectral optical | 1-3 m | At application window | NDVI, Red Edge, zone classification |
With data requirements mapped, the next step is identifying which providers can supply them. The section below covers the most relevant options for agricultural programs, from full-stack analytics SaaS to raw imagery operators.
Satellite data providers for agriculture
The providers below have documented agriculture use cases and data products that map to the tasks in the table above. The mix spans satellite operators, analytics SaaS platforms, and multi-source access points.
| Provider | Type | Best for | Key agriculture spec | Entry point |
|---|---|---|---|---|
| Planet | Satellite operator | Near-daily crop monitoring | 8-band multispectral at 3.7 m | Imagery from $2,700 per year |
| EOS Data Analytics | Analytics platform | End-to-end agronomy workflow | EOS SAT-1 multispectral at 2.8 m | Free tier up to 300 ha |
| EarthDaily | Operator and analytics | Crop intelligence at market scale | 22-band daily constellation | Enterprise contract |
| constellr | Thermal operator | Irrigation and crop water stress | Land surface temperature at 30 m | Quote or UP42 marketplace |
| Sentinel Hub | Data platform | Open archive at scale | Sentinel-2 at 10 m | From $28 per month |
| SkyWatch | Imagery marketplace | Optical and SAR through one API | Multi-operator catalog | Pay-as-you-use, no minimum |
| Sfera Technologies | Multi-source access point | Several sensor types in one contract | Optical from 0.3 m, SAR, thermal | From $4 per km² optical |
For a ranked shortlist of providers by imagery type, our guide to the best optical satellite imagery providers covers the full market with head-to-head specifications. Agriculture programs that prioritize cloud-resilient data should also review the best SAR data providers, whose all-weather coverage complements optical monitoring during cloudy growing seasons.
How to choose satellite data for agriculture
The first decision is whether you need analytics-ready outputs (vegetation stress maps, yield forecasts, irrigation recommendations delivered as finished layers) or raw satellite imagery that your team processes in GIS or a cloud platform. EOSDA Crop Monitoring and EarthDaily’s Ag API deliver the former. Planet’s platform and Sentinel Hub serve teams comfortable with their own processing stack.
Budget and area determine the next cut. For programs covering tens of thousands of hectares continuously, area-based subscriptions from Planet or hectare-tiered SaaS from EOS Data Analytics are structurally cheaper than per-scene ordering. For targeted field campaigns, per-km² tasking or archive ordering through Sfera Technologies, SkyFi, or LandViewer gives cost control without a minimum annual commitment.
Sensor completeness matters at program scale. Optical multispectral imagery handles vegetation indices but cloud cover breaks the time series during critical growth stages in many geographies. Teams running programs in high-cloud regions (tropical agriculture, monsoon zones, northern Europe) should build in a SAR complement, either through a platform aggregator like Sentinel Hub (Sentinel-1 archive) or SkyWatch, or through a direct SAR operator.
Thermal LST from constellr adds the evapotranspiration layer that neither optical nor SAR alone provides.
Data rights and redistribution terms are material for agri-insurance, food security, and government programs: verify whether your intended use (derivative maps, sub-licensing to clients, regulatory submissions) is permitted under the provider’s standard commercial license before committing to a platform.
Verdict
Satellite data has moved from an experimental tool to operational infrastructure for serious agriculture programs. The commodity case, weekly multispectral monitoring for NDVI and Red Edge vegetation indices at field scale, is well-covered by multiple providers at accessible price points. The differentiation lives in frequency, sensor mix, and how much pre-processing is bundled.
For teams that want a fully managed agronomy SaaS, EOS Data Analytics and EarthDaily offer the most complete agriculture-specific analytics stacks. For teams that want maximum data freshness and flexible processing, Planet’s near-daily PlanetScope combined with Sentinel-2 via Sentinel Hub gives a strong optical foundation, though the layer most programs are missing is thermal LST from constellr for irrigation scheduling in water-stressed production systems.
Multi-source programs that need optical, SAR, and thermal from different operators benefit from a single access point rather than managing three separate commercial relationships and data pipelines. For a full ranked view of the optical providers relevant to agriculture, see our optical satellite imagery providers guide. For thermal-specific sourcing, the thermal satellite imagery providers ranking covers the current commercial options.
Frequently asked questions
Below are answers to the questions agriculture buyers most commonly ask. Each answer points to the section where the full detail lives.
How is satellite imagery used in agriculture?
Satellite imagery covers six main workflows: crop health monitoring via NDVI and NDRE, yield estimation from seasonal time series, irrigation management using SAR or thermal data, field boundary and zone mapping, pest and disease detection from Red Edge signatures, and in-season variable-rate application planning. The detail is in “How satellite data is used in agriculture“.
What spectral bands do agriculture programs need?
The minimum useful set for vegetation monitoring is Red, NIR, and Red Edge, which together enable NDVI, NDRE, and CIRE. SWIR bands add sensitivity to water content and are useful for drought stress and soil moisture proxies. Evapotranspiration and crop water stress require a separate thermal LWIR sensor that is distinct from multispectral optical instruments. The full band-to-task mapping is in “What satellite data you need for agriculture“.
What resolution do I need for crop monitoring?
For monitoring field-level variability and within-field zones, 3-10 m resolution is sufficient for most broadacre crops. Field boundary extraction and variable-rate application planning are cleanest at 0.5-3 m. Soil moisture and evapotranspiration products are typically delivered at 10-250 m, which is still actionable for irrigation zone management. Resolution requirements by task are mapped in “What satellite data you need for agriculture“.
Which satellite data providers are best for agriculture?
Planet is the strongest option for near-daily optical monitoring with Red Edge bands at field scale. EOS Data Analytics is the most agriculture-specific SaaS stack, covering vegetation indices, soil moisture, yield prediction, and VRA maps in one platform. EarthDaily targets crop intelligence at commodity and insurance scale, and for thermal LST and crop water stress the leading dedicated option is constellr. Provider details and access models are in “Satellite data providers for agriculture“.
Can satellite data replace field scouting in agriculture?
Satellite data does not replace field scouting but it significantly reduces the area and frequency of manual inspection required by identifying where on a farm anomalies are occurring, so scouts can be directed to high-priority zones rather than covering every field uniformly. Pest and disease identification at species level still requires physical confirmation. The workflow is covered in “How satellite data is used in agriculture“.
How do I choose satellite data for agriculture?
The starting point is your in-house capability: teams without a processing stack should evaluate SaaS platforms like EOSDA Crop Monitoring or Planet’s free trial, while GIS teams can work directly with Sentinel-2. Targeted campaigns benefit from a per-km² access point that avoids annual commitment while scoping requirements. Practical decision guidance is in “How to choose satellite data for agriculture“.

My passions are Earth Observation and Satellites, and my profession is Data Analysis. I combine both within ObservationData.com to show you the use cases of Earth Observation, to help you find the right provider, and to share your experiences.
