
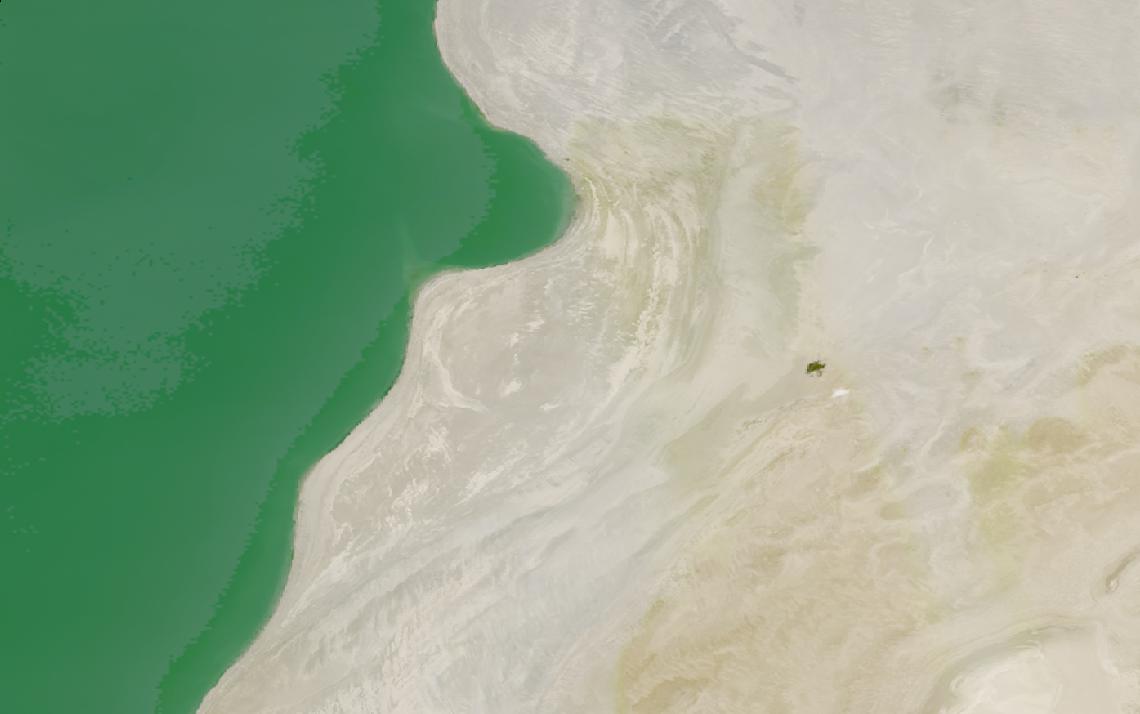
Climate teams need decades-long evidence of change that ground stations cannot supply globally.
Satellite records repeat the same measurement for decades, giving a continuous, comparable series.
This guide matches climate variables to the right data and provider.
Table of Contents
Key takeaways
- Climate programs depend on decades of consistent satellite records, not a single high-resolution image
- Facility-level methane and CO2 detection now works at 25 to 30 m resolution from dedicated satellites
- The shortlist narrows fast once you know whether you need a raw climate variable or a derived product
Before any provider enters the picture, a climate program has to settle what it needs from the data itself. The summary below sets out the sensors, resolution, and cadence that climate monitoring depends on.
| Primary sensors | Multispectral optical, hyperspectral, SWIR |
|---|---|
| Working resolution | 3-30 m optical, 25-30 m GHG columns |
| Typical revisit | Annual archives, near-daily optical |
| Core indices | Land cover class, biomass, CH4/CO2 concentration |
| Entry cost | Free with Carbon Mapper, or from $2 per km² |
| Main constraint | No provider covers every climate variable |
Those figures cover the baseline that most climate monitoring draws on. Programs chasing a specific gas, a carbon stock, or a physical risk score push both the sensor mix and the cost in a different direction.
How satellite data is used in climate
Satellite data enters climate programs at five distinct points, each relying on a different sensor type and delivering different evidence to scientists, corporates, and risk managers.
Essential Climate Variables and the long record
The Global Climate Observing System, which operates under the World Meteorological Organization, defines an Essential Climate Variable as a physical, chemical, or biological variable that critically contributes to the characterization of Earth’s climate. GCOS lists 55 of them across three domains: atmosphere, ocean, and land.
Not every one of the 55 is measurable from orbit, and the ones that are share a demand that no single image satisfies: a multi-decade archive matters more than a sharp single scene. Sentinel Hub, an access platform for the public Sentinel and Landsat archives rather than a satellite operator, starts from $28 per month and reaches back to 1972 for Landsat and 2014 for Sentinel-1.
Commercial providers rarely deliver a climate variable itself. Most sell an analytics layer built on top of public satellite data, tuned to a narrower commercial question than the full climate record. A program that needs a genuine multi-decade variable should start with the public missions behind it, not a vendor dashboard.
Greenhouse gas concentrations and point sources
Atmospheric methane and carbon dioxide are two of the fastest-moving inputs to the climate system, and dedicated satellites now resolve both down to individual industrial facilities. Carbon Mapper leads the coalition behind Tanager-1, a hyperspectral satellite that Planet builds and operates around an instrument designed at NASA JPL. It images at 30 m resolution and reaches a 90 percent probability of detection between 90 and 180 kg of methane per hour.
GHGSat runs a satellite constellation dedicated to greenhouse gas monitoring at roughly 25 m resolution, advertising detection as small as 100 kg of methane per hour under its best-case conditions. Both operators publish data that regulators and researchers use to check emissions inventories independently against what industry self-reports.
Facility-level compliance obligations for oil, gas, and coal operators are covered separately in satellite imagery for energy, since this page tracks the atmosphere as a whole rather than one sector’s rulebook.
Carbon stocks and land cover change
Tracking how land cover shifts, forest to cropland, wetland to urban, is one of the most direct ways satellites measure the land side of the climate system. Impact Observatory produces annual land cover classification from Sentinel-2 at 10 m resolution, with a free 9-class global layer alongside a paid 15-class product priced per square kilometer.
Aboveground biomass is the complementary measurement: how much carbon a landscape is storing, not just what covers it. Chloris Geospatial publishes annual biomass stock and change maps from the year 2000 onwards at 30 m, with 10 m products available, giving climate accounting a baseline that was not invented at the start of a single project.
Forest-level carbon programs and compliance workflows built on similar biomass data are covered in satellite imagery for forestry. The distinction here is measuring the land carbon stock as part of the wider climate system, rather than a single concession or supply chain.
Cryosphere, sea level and ocean heat
Sea level, sea ice extent, and ocean heat content sit in the ocean domain of the climate system, and satellites are the only practical way to track any of them worldwide. Radar altimeters measure sea surface height from orbit, passive microwave sensors follow sea ice through polar darkness, and thermal sensors extend the ocean surface temperature record.
None of the commercial providers covered in this guide run an ocean or cryosphere mission. Long-running public agency programs, not venture-backed startups, are the ones that carry the sea level and ice measurement record forward year after year.
Physical climate risk for assets
Insurers, lenders, and infrastructure owners increasingly need to price physical climate risk into individual assets rather than broad regional averages. Kayrros, an analytics company that draws on more than 20 third-party satellite constellations rather than operating its own, runs a Wildfire Risk Monitor built for investors, insurers, and firefighting agencies, with access starting from a demo request rather than a published price.
The same principle that governs greenhouse gas and land cover tracking applies here, since a risk score is only as good as the historical baseline behind it. A single post-event image confirms damage. A multi-year record is what lets a model separate an unusual season from a genuine shift in risk.
What satellite data you need for climate
Different climate tasks call for different sensor modalities, resolutions, and revisit frequencies. The table below maps each common task to the data specifications it requires.
| Task | Sensor modality | Resolution | Revisit | Key index / band |
|---|---|---|---|---|
| Long-term ECV time series | Multispectral optical, SAR | 10-30 m | Decades, archived | Multi-year composite |
| Methane point-source detection | Hyperspectral, SWIR | 25-30 m | Daily to weekly | CH4 column concentration |
| CO2 point-source detection | Hyperspectral, VNIR-SWIR | 30 m | Weekly | CO2 column concentration |
| Land cover and land-use change | Multispectral optical | 10 m | Annual | Land cover class |
| Aboveground biomass | Optical and LiDAR fusion | 10-30 m | Annual | AGB, biomass change |
| Sea level monitoring | Radar altimetry | Along-track | Days to weeks | Sea surface height |
| Sea ice extent | Passive microwave | ~25 km | Daily | Ice concentration |
| Land and sea surface temperature | Thermal infrared | ~1 km | Daily | Surface temperature anomaly |
| Physical climate risk scoring | Optical, historical archive | 3-10 m | Seasonal to annual | Risk or anomaly index |
With the data requirements mapped, the next step is identifying which providers can supply them. The section below covers the most relevant options for climate programs, from nonprofit data providers to satellite operators and pure analytics platforms.
Satellite data providers for climate
The providers below have documented climate use cases and data products that map to the tasks in the table above. The mix spans nonprofit and commercial satellite operators, analytics platforms, and a multi-source access point.
| Provider | Type | Best for | Key climate spec | Entry point |
|---|---|---|---|---|
| Carbon Mapper | Nonprofit data provider | Independent GHG accounting data | Tanager-1 hyperspectral, 30 m | Free for non-commercial use |
| GHGSat | Satellite operator | Facility-level methane verification | ~25 m resolution, 100 kg/hr floor | Contact for quote |
| Chloris Geospatial | Analytics platform | Carbon stock and change accounting | Annual biomass since 2000, 30 m | From $5,000 per year |
| Impact Observatory | Analytics platform | Land cover and land-use change | 10 m annual, 15 land cover classes | From $2 per km² |
| Planet | Satellite operator | Near-daily optical plus carbon data | Forest Carbon Diligence at 30 m | Imagery from $2,700 per year |
| Sfera Technologies | Multi-source access point | Several sensor types in one contract | Optical, SAR, hyperspectral | From $4 per km² optical |
For a ranked shortlist of general imagery operators, our guide to the best satellite imagery providers covers the wider optical and SAR market. Programs built around gas columns should also check our best hyperspectral imagery providers guide, since a methane plume is resolved through narrow contiguous spectral bands rather than sharper pixels. Biomass is a different problem, answered by radar and lidar structure rather than by spectra.
How to choose satellite data for climate
The first decision is what the climate program has to prove. A public-grade time series, a facility-level emissions estimate, and an asset-level risk score are three different products built from different inputs, and no single vendor is the cheapest route to all three.
If the requirement is a genuine Essential Climate Variable, one of the 55 that GCOS tracks across the atmosphere, ocean, and land domains, the starting point is the public mission behind it rather than a commercial subscription, since vendors add value on top of that public record rather than replacing it.
The measurement target decides the sensor. Greenhouse gas accounting calls for hyperspectral or SWIR spectral imaging tuned to gas absorption bands. Land cover and carbon stock work runs on multispectral optical archives with an annual cadence, while sea level, ice, and ocean heat depend on radar and passive microwave instruments that no provider in this guide operates directly.
Budget follows from scope. A single facility’s emissions or a single asset’s risk score is affordable on a quote or per-scene basis, while a national or regional climate accounting program is cheaper on an annual subscription or a public data pipeline than on repeated one-off orders.
Data rights matter here in a way they do not in faster-moving verticals. Verify whether your intended use, including public disclosure, regulatory submission, and academic publication, is permitted under a provider’s standard license before building a multi-year program around a single commercial source.
Verdict
Climate is the vertical where satellite data is judged on discipline rather than sharpness. A single crisp image proves little about whether a variable is genuinely shifting. An unglamorous archive running on the same calibration for decades, like the Landsat record stretching back to 1972, proves the point instead.
Programs chasing a genuine Essential Climate Variable should start with the public missions behind it. Programs needing facility-level accountability have real options today: Carbon Mapper and GHGSat both resolve methane to the scale of a single industrial site, while Chloris Geospatial and Impact Observatory turn similar archives into carbon stock and land cover accounting.
Programs spanning gas accounting, land carbon, and asset-level risk draw on hyperspectral, optical, and analytics products from different vendors, and rarely settle for one source once the full picture is in view. For the operators and platforms covering the wider market, see our satellite imagery providers guide and, for gas sensing specifically, our hyperspectral imagery providers ranking.
Frequently asked questions
Below are answers to the questions climate data buyers most commonly ask. Each answer points to the section where the full detail lives.
How is satellite data used to track climate change?
Satellite data supports five core climate workflows: tracking Essential Climate Variables over the long record, greenhouse gas concentrations at point sources, carbon stocks and land cover change, cryosphere and ocean measurements, and physical climate risk scoring for individual assets. The detail is in “How satellite data is used in climate“.
What is a GCOS Essential Climate Variable?
The Global Climate Observing System defines an Essential Climate Variable as a physical, chemical, or biological variable that critically contributes to characterizing Earth’s climate. GCOS names 55 of them across the atmosphere, ocean, and land domains. The concept is covered in “How satellite data is used in climate“.
Can satellites measure greenhouse gas emissions from a single facility?
Yes. The Tanager-1 satellite, whose data Carbon Mapper publishes, resolves methane and CO2 at 30 m resolution, and GHGSat’s constellation works at roughly 25 m, both fine enough to attribute a plume to a specific piece of industrial equipment. More on both operators is in “Satellite data providers for climate“.
How far back does satellite climate data go?
Public archives reach back decades: Landsat imagery is available from 1972 and Sentinel-1 radar from 2014, both accessible through cloud platforms without downloading raw scenes. Commercial products differ, since Chloris Geospatial’s annual biomass record begins in 2000 while facility-level methane data only exists since the relevant satellite launched. Archive depth by task is covered in “What satellite data you need for climate“.
Which satellite data providers are best for climate?
Carbon Mapper and GHGSat lead on facility-level greenhouse gas detection, Chloris Geospatial and Impact Observatory turn satellite archives into carbon stock and land cover accounting, and Planet’s near-daily optical archive supports both monitoring and derived carbon products. Sfera Technologies is a useful entry point for programs that need several sensor types through one commercial contract. Provider details are in “Satellite data providers for climate“.
Do I need a commercial provider or can I use public satellite data for climate work?
Public missions are the right starting point for a genuine climate variable, and platforms like Sentinel Hub exist specifically to make that archive usable without new infrastructure. A commercial provider earns its price once you need facility-level detail or a derived analytics product the public archive does not offer on its own. The trade-off is discussed in “How to choose satellite data for climate“.

My passions are Earth Observation and Satellites, and my profession is Data Analysis. I combine both within ObservationData.com to show you the use cases of Earth Observation, to help you find the right provider, and to share your experiences.
