
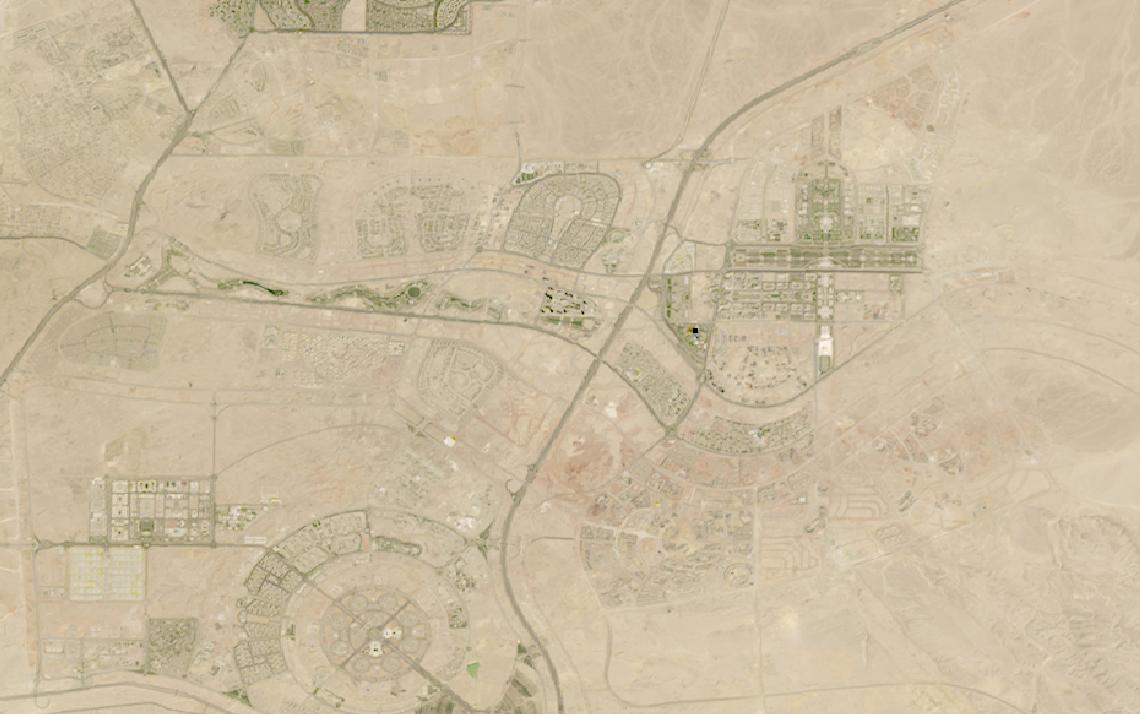
Site conditions, earthwork and settlement change faster than routine ground surveys keep pace.
Overhead imagery gives a dated, repeatable record, turning progress into evidence instead of memory.
This guide matches construction stages to the right data and provider.
Table of Contents
Key takeaways
- Construction portfolios spanning many sites lean on continuous archive coverage that no site walk matches
- Daily site-level tracking is a job for drones, but archive-based independent evidence is where satellite data wins
- The shortlist narrows fast once you know whether you need pre-construction terrain models or ongoing progress imagery
Before any provider enters the picture, a construction program has to settle what altitude and cadence the job actually needs. The summary below sets out the sensors, resolution, and constraint that overhead monitoring runs into on a job site.
| Primary sensors | VHR optical, SAR, airborne elevation radar |
|---|---|
| Working resolution | 2.5 cm-1.5 m optical, 3-20 m InSAR |
| Typical revisit | Daily tasking to annual aerial refresh |
| Core indices | DSM/DTM elevation, InSAR displacement |
| Entry cost | From $1 per km² (elevation data) |
| Main constraint | Fine site-level detail still needs drones |
Those figures cover the ceiling and the floor of what orbit and aircraft can deliver. Which one a project actually needs depends on the stage of the build and the scale of the site, covered next.
How satellite data is used in construction
Overhead data enters a construction project at six distinct points, from the decision to build somewhere at all through to the dispute that follows a delay, each pulling on a different platform and a different revisit rate.
Site selection and pre-construction baseline
Before a site is chosen, a developer needs to know what is actually there: existing structures, impervious surface, and flood zone exposure. Ecopia AI applies AI-based feature extraction to partner-sourced aerial and satellite imagery, producing building footprints with FEMA flood zone data pre-appended and land cover layers at over 95 percent geometric accuracy.
The zone letter that comes back matters beyond risk appetite. A, AE, AH, AO, AR and A99 inland, V and VE on the coast, are the high-risk designations, and inside a National Flood Insurance Program community they attach a flood insurance requirement to any federally backed mortgage on what gets built there.
For a candidate site’s history, a decades-deep optical archive answers questions a single site visit cannot: whether ground was disturbed before, and what stood there previously. Airbus can pull imagery back to 1986, and Nearmap’s US archive reaches back to 2014 in its covered metro areas.
Terrain and elevation models before ground is broken
Every design decision that follows groundbreaking rests on an accurate terrain model, and the choice is between three different capture methods. Airbus derives a digital surface model and terrain model on demand from Pléiades Neo stereo imagery, delivered at 0.5-meter resolution anywhere the constellation can task.
Optical stereo needs a clear sky, which is not guaranteed everywhere. Intermap flies its own radar instrument, an interferometric SAR system that images through cloud, and delivers elevation models at 1 to 5-meter resolution across more than 60 countries, including terrain that stereo optical cannot reliably reach.
For a single site where centimeter precision matters more than global reach, Vexcel also derives a surface and terrain model from its own aerial capture, aligned pixel-for-pixel with its orthomosaic imagery, in the countries the program covers.
Progress monitoring across large and linear projects
This is where satellite and wide-area aerial data genuinely outperform a site-level survey: a highway corridor, a rail line, or a pipeline right-of-way running for hundreds of kilometers is uneconomical to fly block by block, but a single VHR pass covers it in one sweep.
Airbus tasks Pléiades Neo at 30-centimeter resolution with a daily revisit and SPOT 6 across a 60-kilometer swath, wide enough to cover an entire corridor or multi-site program in a single pass rather than stitching together dozens of smaller scenes.
For a portfolio of building sites across a metro area rather than a single corridor, Nearmap, Vexcel, and EagleView each refresh their covered markets on a fixed annual or multi-times-a-year schedule, useful for tracking many projects at once but not for the day-to-day sequencing a superintendent manages on site.
Earthwork and stockpile volumes
Cut, fill, and stockpile volumes come from differencing two elevation models captured at different dates, the same math a drone survey uses at a finer cadence. Airbus’s on-demand elevation product, derived from Pléiades Neo stereo pairs at 0.5 meters, supports this at the scale of a full site or concession rather than a single stockpile.
The trade-off is cadence, not accuracy: a satellite or aerial elevation model is captured on a schedule the operator sets, while a stockpile that needs weekly reconciliation for payment or inventory still calls for a drone flight on the contractor’s own timeline.
Settlement and ground movement during and after build
Once a foundation is in and a structure starts to load its footprint, an owner needs to know whether the ground is moving and by how much. TRE ALTAMIRA processes SAR imagery through its proprietary SqueeSAR algorithm to detect displacement at an average precision below 1 millimeter per year, and its CONTECO CHECK partnership applies the same processing specifically to construction project monitoring.
Ground movement near a tunneling project is the same measurement at greater depth. TRE ALTAMIRA’s InSAR analytics tracked how nearby structures responded to excavation during construction of the Grand Paris Express.
The same technique also works backwards. After the 2021 collapse of an elevated section of Mexico City’s Metro Line 12, the company reprocessed an archive of radar images over the viaduct and found displacement rates that had increased in the months before the failure, which is an argument for building the baseline while the structure is still standing.
In Europe, part of that baseline already exists at no cost. The Copernicus European Ground Motion Service derives millimetre-scale displacement from Sentinel-1 across the participating countries, updated annually, with dams, bridges, railways and buildings among its stated uses.
It runs on a continental schedule rather than a contractor’s, so it will not replace a commissioned survey. What it will do is show whether the ground under a site was already moving before anyone broke ground on it.
Independent evidence in claims and disputes
When a delay claim, a damage claim, or a boundary dispute ends up in front of an arbitrator, a dated image captured by an operator with no stake in the outcome carries more weight than either party’s own photographs. Airbus, Nearmap, Vexcel, and EagleView all hold multi-year archives that can be pulled for a specific date rather than recreated after the fact.
Change over time is easier to prove than a single snapshot. Ecopia AI’s annual update cycle turns a building footprint layer into a year-over-year change record, and TRE ALTAMIRA’s InSAR Historical Analysis service reprocesses archived radar scenes going back to 1992 to establish when ground movement actually began.
What satellite data you need for construction
Different stages of a construction project call for different sensor types, resolutions, and revisit frequencies. The table below maps each common task to the data specifications it requires.
| Task | Sensor modality | Resolution | Revisit | Key index / band |
|---|---|---|---|---|
| Site selection and feasibility | VHR optical archive | 2.5 cm-1.5 m | Archival, on demand | Land cover, historical change |
| Pre-construction baseline mapping | AI feature extraction (optical-derived) | Sub-meter derived | Annual update | Building footprints, land cover |
| Terrain and elevation modeling | Stereo optical, IFSAR, or aerial DSM | 7.5 cm-5 m | One-time or on demand | DSM, DTM |
| Progress monitoring, large or linear sites | VHR optical (satellite or aerial) | 2.5 cm-1.5 m | Daily to annual | Change detection |
| Earthwork and stockpile volumes | Stereo optical DSM differencing | 0.5 m | Per campaign | Volumetric change |
| Settlement and ground movement | SAR (InSAR) | 3-20 m | 6-12 days | Millimetric displacement |
| Dispute and claims evidence | Dated optical or SAR archive | 4 cm-1.5 m | Historical, dated | Timestamped imagery |
With data requirements mapped, the next step is identifying which providers can supply them. The section below covers the most relevant options for construction programs, from aerial capture operators to elevation and analytics specialists.
Satellite data providers for construction
The providers below have documented construction use cases and data products that map to the tasks in the table above. The mix spans aerial imagery operators, a satellite operator, an elevation specialist, an analytics platform, and a multi-source access point.
| Provider | Type | Best for | Key construction spec | Entry point |
|---|---|---|---|---|
| Nearmap | Aerial imagery provider | Urban site imagery, US/AU/NZ | 4.4-7.5 cm GSD, up to 3x/year | Contact sales |
| Vexcel | Aerial imagery provider | AEC imagery across 45+ countries | 7.5-15 cm ortho and oblique | Demo request |
| EagleView | Aerial imagery provider | Contractor site planning | 1-inch (2.54 cm) GSD, annual | Per-report or subscription |
| Airbus | Satellite operator | Pre-construction DEM and VHR | On-demand DSM/DTM at 0.5 m | Quote or UP42 marketplace |
| Ecopia AI | Analytics platform | Building and land-cover baseline | Over 95% extraction accuracy | Data Portal by request |
| Intermap | Elevation data provider | All-weather DEM, 60+ countries | IFSAR DEM at 1-5 m resolution | From $1 per km² |
| Sfera Technologies | Multi-source access point | Several sensor types in one contract | Optical, SAR, hyperspectral | From $4 per km² optical |
For a deeper comparison across resolution and pricing, our guide to the best high-resolution satellite imagery providers covers sub-meter optical in more depth, and the best satellite imagery providers guide ranks options across every sensor type and access model.
How to choose satellite data for construction
My advice on construction sites is to be honest about cadence. Satellite revisit is measured in days while a site changes by the hour, so the data supports progress verification and dispute evidence, but it will not replace what a site walk tells you.
The first question is what the data has to prove, not just what it should show. A dated basemap for permitting, a progress record for a lender, and a certified survey for a dispute are different deliverables built from different capture methods, and a provider strong at one is rarely the fastest route to another.
For the scale of a single job site, satellite data is often the wrong tool. A drone survey delivers centimeter detail on demand, any day the contractor needs it, at a cost no orbital or aircraft program can match at that scale.
Satellite and wide-area aerial data earn their place at a different scale. Corridors spanning hundreds of kilometers, a documented before-state pulled from the archive, an independent record in a dispute, or a portfolio of sites too numerous to fly individually are the cases where orbit and aircraft win.
Project geometry decides which capture method fits. A single compact site is well served by a one-off drone survey or a tasked VHR pass, while a scattered portfolio, a long linear corridor, or a site with no clear sky window points toward a subscription program, a satellite tasking order, or an all-weather radar-based elevation model.
Budget follows from how often the answer actually needs updating. A single pre-construction baseline or a one-time volumetric survey is a case for per-order or per-km² pricing rather than a standing subscription, while a multi-year program spanning many sites benefits from a contract priced for repeat capture.
Data rights matter most for the dispute scenario: verify before committing whether the provider’s standard license permits submission as third-party evidence in arbitration or litigation, since imagery bought for internal progress tracking is not always cleared for that use.
Verdict
Construction is the vertical where the right answer is often not a satellite at all. For the scale of a single active site, a drone survey remains faster, cheaper, and sharper than any orbital or aircraft program, and providers in this guide do not claim otherwise.
Where satellite and wide-area aerial data earn their place is scale and continuity: Airbus for daily-tasked VHR and on-demand elevation across a whole corridor, Intermap for all-weather terrain models where cloud blocks optical stereo, and Nearmap, Vexcel, and EagleView for portfolio-wide progress across covered metro markets. Ecopia AI turns that imagery into a pre-construction baseline, and TRE ALTAMIRA’s InSAR archive answers the settlement question.
Sfera Technologies rounds out the picture as a single point of contact across optical, SAR, and hyperspectral data for teams that would otherwise juggle several vendor relationships. For the full ranked market, see our guides to the best high-resolution satellite imagery providers and the best satellite imagery providers.
Frequently asked questions
Below are answers to the questions construction buyers most commonly ask. Each answer points to the section where the full detail lives.
How is satellite data used in construction?
Overhead data supports six workflows in construction: site selection and pre-construction baseline mapping, terrain and elevation modeling, progress monitoring across large and linear projects, earthwork and stockpile volumes, settlement and ground movement, and independent evidence in claims and disputes. The detail is in “How satellite data is used in construction“.
Can satellites replace drones on a construction site?
No. A drone survey still beats any satellite or aircraft program for centimeter-level daily detail on a single site. Satellite and wide-area aerial data add the scale, archive, and independence a single drone flight cannot provide. The trade-off is covered in “How to choose satellite data for construction“.
What resolution do I need for construction site monitoring?
Site selection and dispute evidence work at 2.5 centimeters to 1.5 meters, matching what VHR aerial and satellite archives deliver. Terrain models run from 7.5 centimeters to 5 meters depending on method, and settlement monitoring typically works at 3 to 20 meters, because InSAR reads displacement from the radar phase rather than from pixel size. The full task-to-resolution mapping is in “What satellite data you need for construction“.
Can satellites measure earthwork and stockpile volumes?
Yes, by differencing two elevation models captured at different dates, the same principle a drone survey uses at a finer cadence. Airbus derives an on-demand digital surface model from Pléiades Neo stereo imagery at 0.5-meter resolution for exactly this purpose. The method is described in “How satellite data is used in construction“.
Can satellites detect building settlement after construction?
Yes. SAR-based InSAR analytics detect ground displacement at an average precision below 1 millimeter per year, the leading method for tracking whether a completed structure or the ground beneath it is still moving. More detail is in “How satellite data is used in construction“.
Which satellite data providers are best for construction?
Airbus covers daily-tasked VHR optical and on-demand elevation for large or linear sites, Intermap supplies all-weather terrain data, and Nearmap, Vexcel, and EagleView track portfolio-wide progress across their covered metro markets. Ecopia AI adds pre-construction baseline mapping, and Sfera Technologies gives access to several sensor types under one contract. Provider details are in “Satellite data providers for construction“.

My passions are Earth Observation and Satellites, and my profession is Data Analysis. I combine both within ObservationData.com to show you the use cases of Earth Observation, to help you find the right provider, and to share your experiences.
