
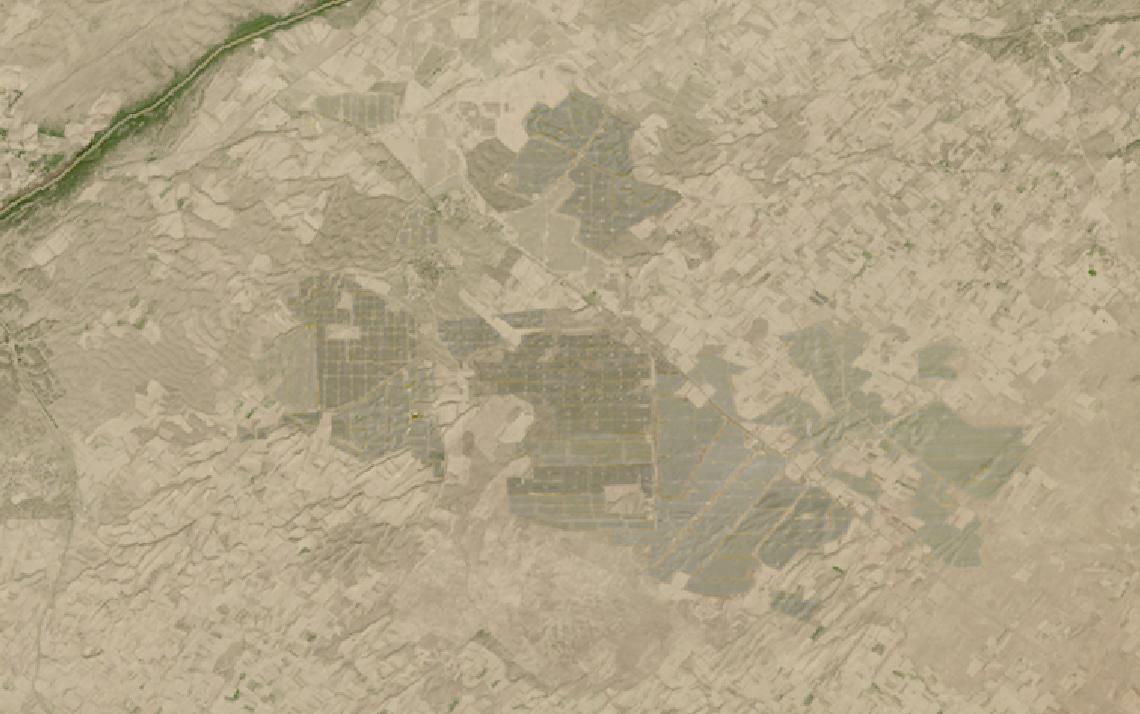
Transmission corridors, plants and renewable sites spread beyond what ground inspection can cover.
Satellite sensors track heat, gas and vegetation risk, giving continuous, comparable records.
This guide matches energy operations to the right data and provider.
Table of Contents
Key takeaways
- Energy programs face a hard regulatory deadline, since EU rules define a super-emitter as over 100 kg of methane per hour
- Grid corridors, thermal plants, and methane sources each need a different sensor and revisit combination
- The right shortlist narrows fast once you know whether you are watching a single facility or an entire grid
Before any provider enters the picture, an energy program has to define what the data itself must deliver. The summary below sets out the sensors, resolution, and cadence that most energy monitoring workflows share.
| Primary sensors | Multispectral optical, thermal infrared, SWIR |
|---|---|
| Working resolution | 25-30 m methane, 250 m solar |
| Typical revisit | Daily for methane monitoring |
| Core indices | NDVI, methane concentration, GHI/DNI |
| Entry cost | Free with Carbon Mapper, or by subscription |
| Main constraint | Leaks under 100 kg/hr evade satellites |
Those figures describe the baseline that covers most grid and generation monitoring. Programs chasing regulatory-grade methane accounting or sub-meter damage assessment push both the sensor mix and the cost higher.
How satellite data is used in energy
Satellite data enters energy programs at six distinct points, each relying on a different sensor type and delivering different decision support to grid operators, plant managers, and compliance teams.
Methane detection and the EU monitoring obligation
Regulation (EU) 2024/1787 turns methane monitoring from a voluntary metric into a hard compliance obligation for the energy sector. Article 2 defines a super-emitting event as a single source, or a closely connected set of sources at one site, releasing more than 100 kg of methane per hour.
The regulation also required the Commission to stand up a rapid reaction mechanism for super-emitting events by 5 February 2026, a deadline that has already come and gone. A separate obligation remains live: by 5 August 2026, the Commission must launch a global, satellite-based methane monitoring tool built in part on the Copernicus program.
Part of that Copernicus layer is already running. The Atmosphere Monitoring Service opened its Methane Hotspot Explorer in February 2025, mapping the largest plumes the Sentinel-5P TROPOMI instrument picks up on a daily to 14-day cycle and separating coal, oil and gas, and urban sources. It is a screening layer rather than a facility-level record, which is where the commercial operators below come in.
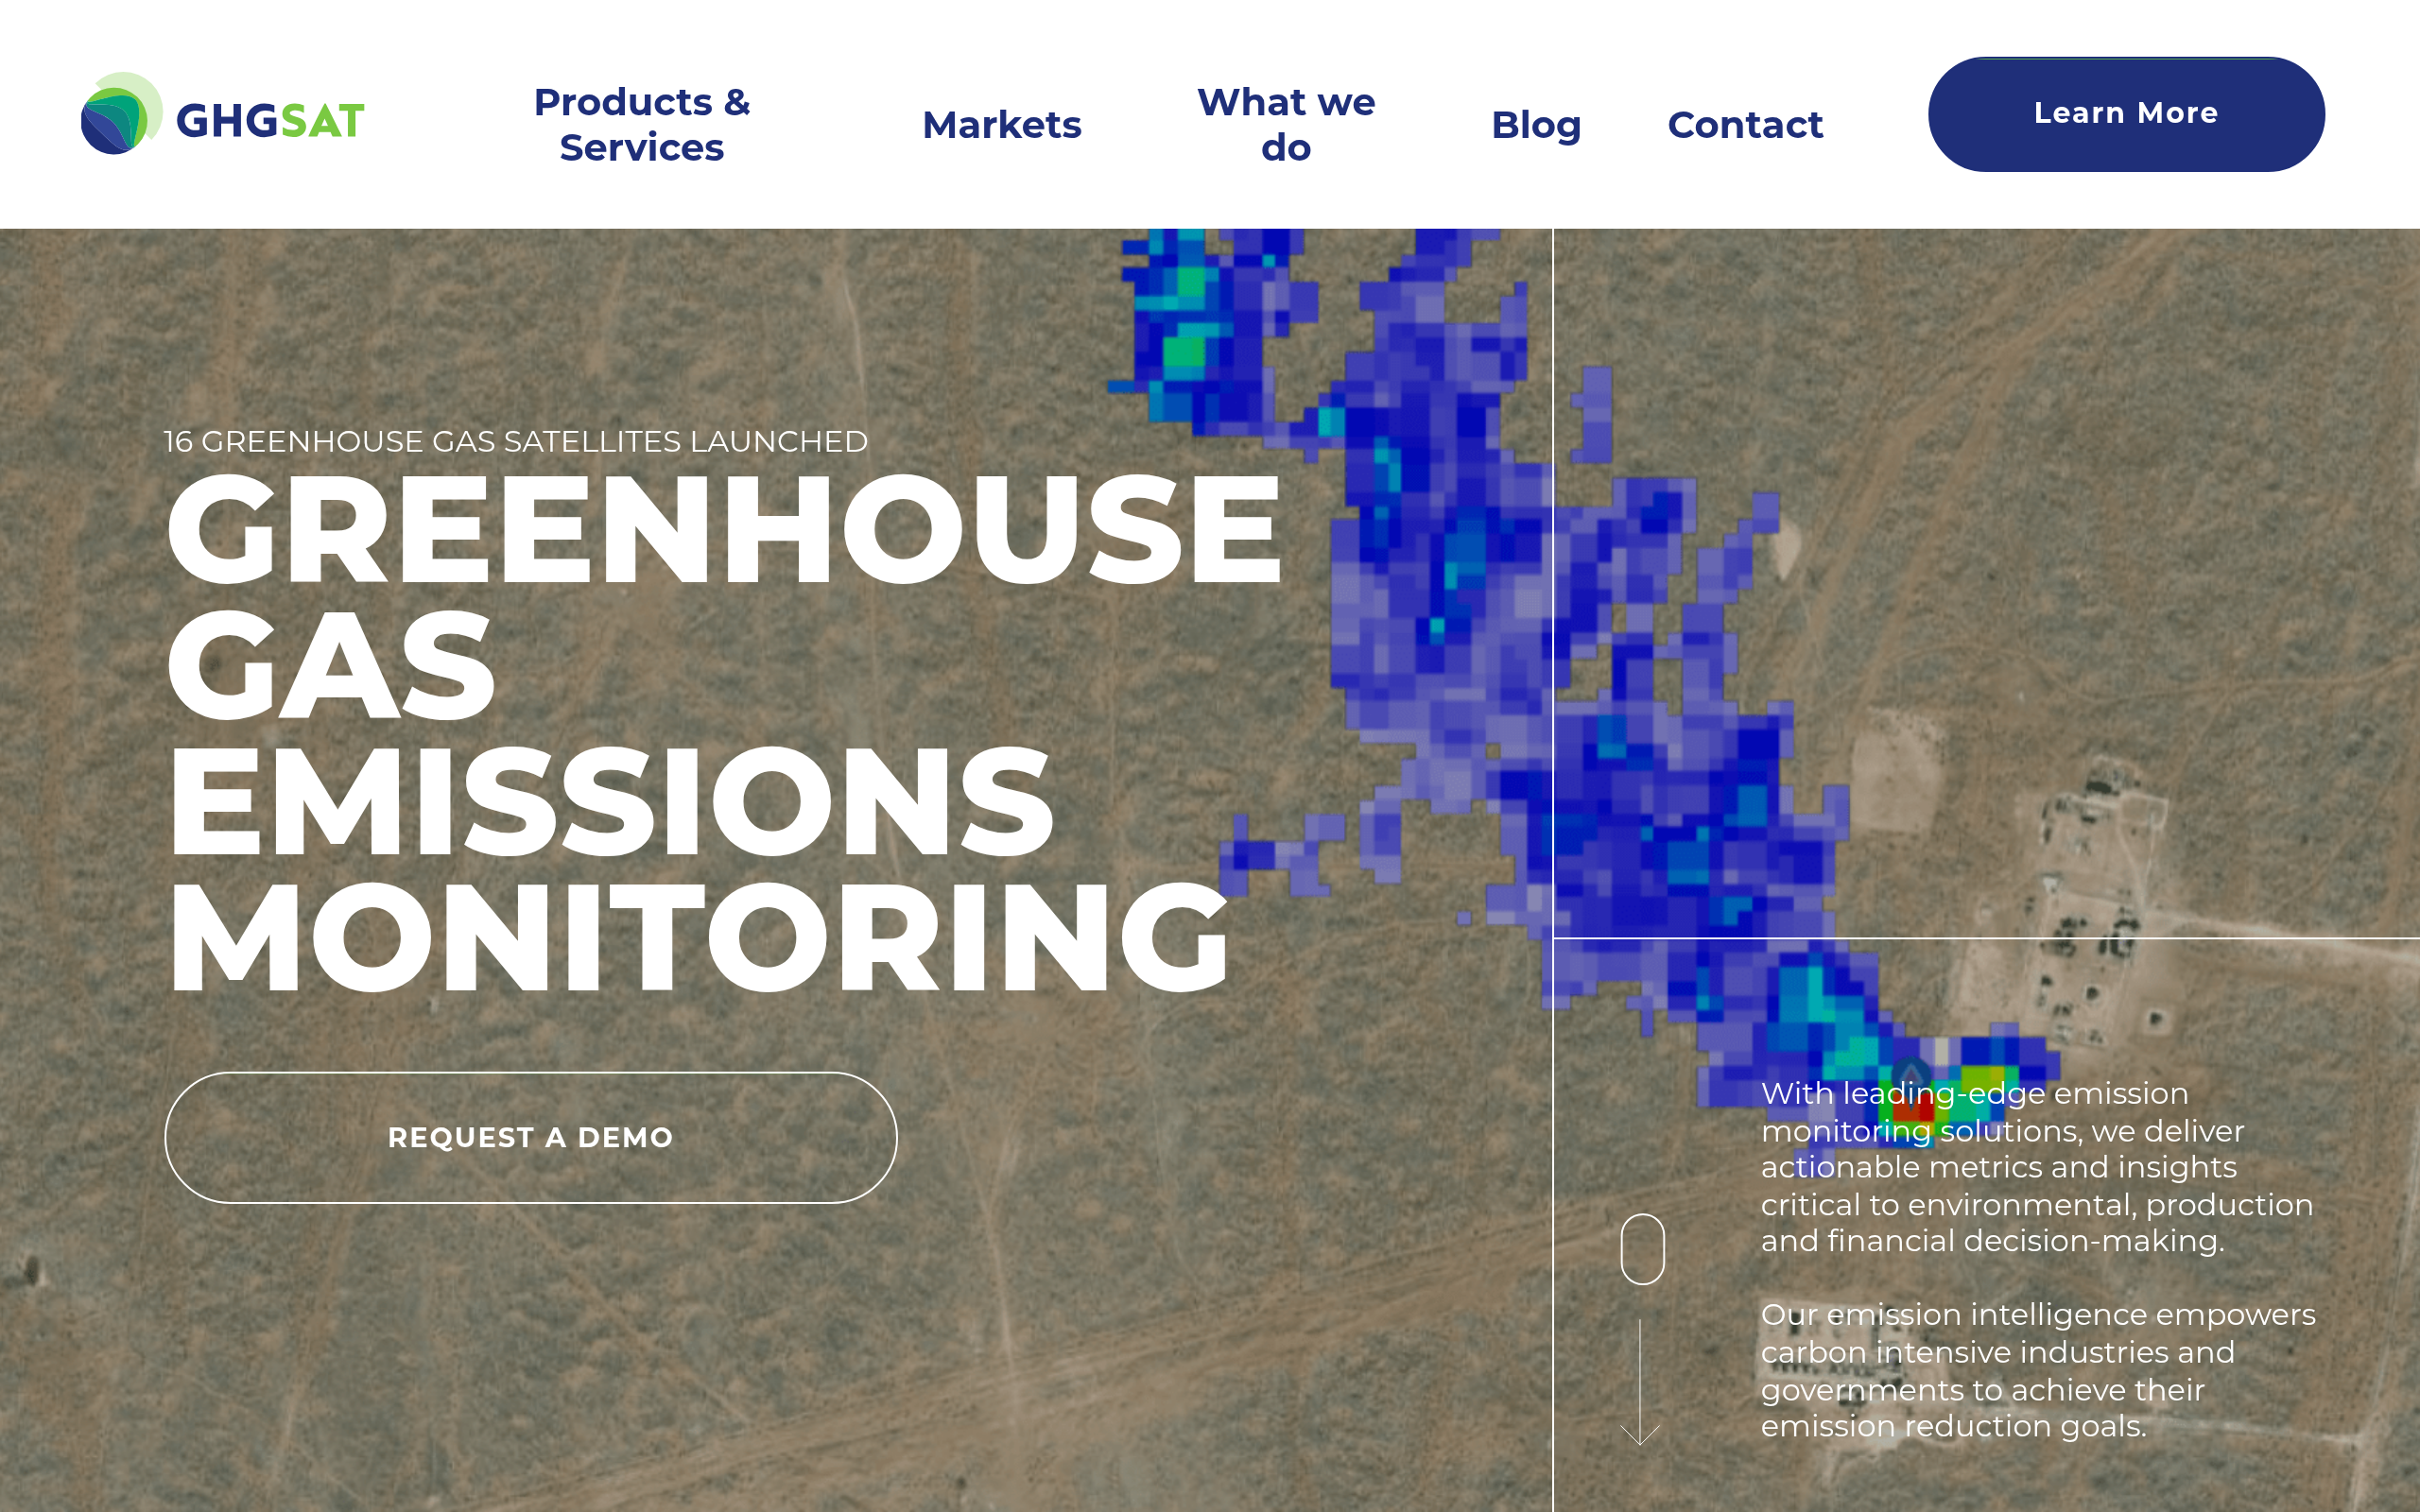
Commercial and nonprofit operators already supply the detection layer the rule calls for. GHGSat operates a satellite constellation dedicated to greenhouse gas monitoring at roughly 25 m resolution, advertising a detection floor as small as 100 kg of methane per hour, the same threshold the regulation uses to define a super-emitter.
Carbon Mapper leads a philanthropically funded coalition with NASA JPL and Planet. Planet builds and flies the Tanager-1 satellite around a spectrometer designed at JPL, and Carbon Mapper publishes the resulting methane and CO2 plume data free for non-commercial use. At 30 m resolution, Tanager-1 reaches a 90 percent probability of detection between 90 and 180 kg of methane per hour, depending on conditions.
Kayrros takes a different route, owning no satellites and deriving its products from more than 20 third-party satellite constellations. Its Methane Watch platform is the one the company calls the monitoring platform of choice for regulators including the International Methane Emissions Observatory and the US government. It reports satellite-derived methane estimates typically run two to ten times larger than company-reported figures, the gap the EU’s own monitoring tool is designed to close.
Gas flaring and thermal plant monitoring
Flaring, whether planned or illegal, and the steady heat output of a refinery or power station are visible from orbit long before an operator discloses them. Thermal infrared sensors read the heat signature directly, regardless of what gets reported.
SatVu operates its own thermal infrared satellite constellation, delivering what it describes as the world’s highest-resolution commercially available thermal imagery, day and night. Its stated use cases list gas flaring, both planned and illegal, alongside refineries, power stations, and LNG terminals.
The same sensor extends to plant operations beyond fossil generation, tracking heat faults at solar farms and data center cooling performance, since any facility that runs hot leaves a signature a thermal satellite can read.
Analytics platforms extend the same idea to plant operations on the ground. Satelytics processes multispectral and hyperspectral imagery for power utility customers to flag thermal plumes at post-combustion waste sites, alongside vegetation and encroachment tasks on the same contract.
Transmission grid vegetation management
Vegetation encroachment on transmission and distribution corridors is a leading cause of preventable power outages, and a single network can span hundreds of thousands of kilometers that no walking crew inspects on a useful cycle.
LiveEO’s Treeline platform applies AI to satellite and LiDAR data from partners to flag grow-in, fall-in, and vitality risk along power lines and rail corridors, and the company says it now monitors more than one million kilometers of grid worldwide.
In a published case study, German distribution utility E.DIS reported a 15 percent increase in reliability after adopting the platform, alongside a measurable drop in vegetation-caused outages.
Satelytics runs a comparable vegetation analytics service for power utility customers, including Southern Company, Alabama Power, and Duke Energy, tracking growth, health, and species mix along rights-of-way from imagery its cloud platform ingests from any satellite, aircraft, or fixed camera.
Solar and wind siting and performance
Choosing where to build a solar or wind project, and proving how it performs afterward, both depend on a long, high-quality resource record that few ground station networks can match at a global, site-specific scale.
Solargis derives solar irradiance from geostationary weather satellites rather than operating any hardware of its own, producing global horizontal and direct normal irradiance data at 250 m resolution and sub-hourly time steps. Validated against a network of ground stations, its global horizontal irradiance shows a mean bias of just 0.5 percent.
That precision is tight enough to underwrite bankable energy yield assessments before construction begins. Once a project breaks ground, monitoring shifts to progress tracking: Kayrros runs a Solar Construction Monitor that follows buildout schedules against the satellite record rather than developer self-reporting.
Hydropower reservoirs and water availability
Reservoir levels behind a hydropower dam set how much electricity a plant can generate that season, and a shrinking reservoir is often the earliest visible sign of a generation shortfall, months before it shows up in output figures.
Multispectral imagery maps the reservoir’s water extent directly, using the contrast between water and land in the near-infrared and shortwave-infrared bands, while radar keeps that record continuous through the cloud cover that often sits over mountain catchments. Neither technique needs a sensor built specifically for hydropower, so the same optical and radar archives that cover a utility’s other assets extend to reservoir monitoring at no added sensor cost.
Asset damage and outage assessment
When a storm, wildfire, or grid failure knocks out power across a region, utilities and insurers need to know which substations, plants, and lines are actually down, not just where the storm passed through.
Thermal imagery answers a question optical alone cannot: whether a facility is actually running. SatVu’s sensor tracks heat output at power stations and infrastructure sites day and night and through smoke, the same capability it applies to refineries and LNG terminals, extended here to confirm whether generation has resumed after an outage.
For physical damage, very high resolution optical tasked right after the event remains the standard tool, comparing a fresh capture against the pre-event archive to flag downed lines, collapsed towers, and flooded substations at the scale insurers and regulators need for claims and restoration planning.
What satellite data you need for energy
Different energy tasks call for different sensor modalities, resolutions, and revisit frequencies. The table below maps each common task to the data specifications it requires.
| Task | Sensor modality | Resolution | Revisit | Key index / band |
|---|---|---|---|---|
| Methane super-emitter detection | SWIR spectral imaging | 25-30 m | Daily to weekly | CH4 column concentration |
| Facility CO2 monitoring | VNIR-SWIR hyperspectral | 30 m | Weekly | CO2 column concentration |
| Gas flaring detection (wide-area) | Thermal infrared | 375 m-1 km | Sub-daily | Brightness temperature |
| Thermal plant and asset monitoring | Thermal infrared (MWIR) | High-resolution | Per tasking | Heat signature, hotspot |
| Transmission corridor vegetation | Multispectral optical, SAR | 3-10 m | 5-12 days | NDVI, encroachment change |
| Solar resource assessment | Derived solar irradiance | 250 m | Sub-hourly | GHI, DNI |
| Solar and wind construction tracking | Multispectral optical | 3-10 m | Near-daily | Change detection |
| Hydropower reservoir extent | Multispectral optical, SAR | 10-30 m | 5-12 days | NDWI, SAR backscatter |
| Storm and outage damage assessment | Very high-resolution optical | 0.3-1.5 m | Post-event tasking | Change detection |
With the data requirements mapped, the next step is identifying which providers can supply them. The section below covers the most relevant options for energy programs, from satellite operators to analytics platforms.
Satellite data providers for energy
The providers below have documented energy use cases and data products that map to the tasks in the table above. The mix spans satellite operators, analytics platforms, and a nonprofit mission.
| Provider | Type | Best for | Key energy spec | Entry point |
|---|---|---|---|---|
| GHGSat | Satellite operator | Facility-level methane detection | ~25 m resolution, 100 kg/hr floor | Contact for quote |
| Kayrros | Analytics platform | Methane monitoring for regulators | 20+ satellite constellations fused | Demo request |
| Carbon Mapper | Nonprofit data provider | Free public methane and CO2 data | Tanager-1, 30 m, 90-180 kg/hr PoD | Free for non-commercial use |
| SatVu | Satellite operator | Thermal imaging of energy assets | World’s highest-res thermal imagery | Quote-based |
| LiveEO | Analytics platform | Transmission vegetation management | Treeline: over 1M km of grid | Enterprise contract |
| Planet | Satellite operator | Near-daily optical site monitoring | PlanetScope 3-3.7 m, near-daily | Imagery from $2,700 per year |
| Solargis | Data and analytics provider | Solar resource assessment | GHI bias 0.5%, 250 m resolution | From €2,400 per year |
For a ranked shortlist across the sector, our guide to the best thermal satellite imagery providers covers heat and flaring detection in depth, and our broader best satellite imagery providers guide ranks the full optical and multi-sensor market.
How to choose satellite data for energy
What I watch in energy programs is the gap between a detection and an obligation. Most of the data on this page can flag an anomaly quickly, but only measurements traceable to a documented method survive a regulator’s review, and that distinction decides which vendor fits.
The first decision is what the data has to prove. A regulatory-grade methane record and a plant maintenance alert feed are different products built from different sensors, and a vendor strong at one is rarely the cheapest route to the other.
Regulatory exposure sets the second cut. If your operations fall under the EU’s methane rules, the Commission’s global satellite monitoring tool goes live by 5 August 2026, and operators should already be able to reconcile their own emissions data against outside satellite estimates rather than encountering the comparison for the first time in public.
Asset type decides the sensor. Combustion and heat-generating assets, flares, refineries, thermal plants, call for thermal infrared. Grid corridors need optical and radar for vegetation and encroachment. Solar and wind projects run on derived irradiance data rather than raw imagery at all.
Budget follows from scale and cadence. Continuous monitoring of a large grid or generation fleet is cheaper on an area or asset subscription than on per-scene ordering, while a one-off siting study or damage assessment after a single event is the case for per-image or per-tasking pricing without an annual commitment.
Data rights matter here in a way they do not elsewhere: verify whether your intended use, including regulatory submissions, public disclosure of derived maps, and sharing with insurers or auditors, is permitted under the provider’s standard license before committing budget to a single source.
Verdict
Energy is the vertical where satellite data now carries the force of law rather than just operational convenience. Methane detection at facility scale is available today from both nonprofit and commercial operators, well ahead of the Commission’s own 2026 monitoring tool.
Grid operators need a different toolkit built for scale and repetition: vegetation analytics that watch an entire network on a repeating cycle rather than a single high-resolution snapshot. Renewable developers need the opposite, a long resource record before a single panel goes into the ground.
Programs spanning methane compliance, grid vegetation, and renewable siting draw on thermal, optical, radar, and derived climate data from different vendors, and rarely settle for a single source once the full asset base is in view. For the operators and analytics platforms covering the rest of the market, see our best thermal satellite imagery providers guide and our wider best satellite imagery providers ranking.
Frequently asked questions
Below are answers to the questions energy buyers most often ask. Each answer points to the section where the full detail lives.
How is satellite data used in the energy sector?
Satellite data supports six core energy workflows: methane detection under the EU’s new monitoring rule, gas flaring and thermal plant monitoring, transmission grid vegetation management, solar and wind siting and performance, hydropower reservoir tracking, and outage and damage assessment. The detail is in “How satellite data is used in energy“.
What does the EU Methane Regulation require for satellite monitoring?
Regulation (EU) 2024/1787 requires the European Commission to launch a global, satellite-based methane monitoring tool, built in part on Copernicus, by 5 August 2026. It also defines a super-emitter as any source releasing more than 100 kg of methane per hour. The obligation is covered in “How satellite data is used in energy“.
What resolution do I need for energy monitoring?
Methane and CO2 detection works at 25 to 30 m, the resolution of today’s dedicated greenhouse gas satellites. Grid vegetation and construction tracking run on 3 to 10 m optical and radar, while solar resource data is delivered at 250 m and sub-hourly time steps. The full task-to-resolution mapping is in “What satellite data you need for energy“.
Can satellites detect gas flaring or methane leaks?
Yes. Thermal infrared satellites read the heat signature of a flare directly, while dedicated methane sensors measure gas concentration from orbit, with the best current systems reaching detection floors near 100 kg per hour. Both approaches are described in “How satellite data is used in energy“.
Which satellite data providers are best for energy?
GHGSat and Carbon Mapper lead on facility-level methane detection, Kayrros brings the widest market coverage across methane, solar, and grid analytics, and SatVu supplies the thermal imagery that flaring and asset monitoring depend on. LiveEO and Solargis cover grid vegetation and solar resource assessment. Provider details are in “Satellite data providers for energy“.
How do satellites monitor solar and wind performance after construction?
Once a plant is operating, satellite-derived irradiance data lets owners compare actual output against the resource that should be available, flagging underperformance early. Kayrros extends the same idea to construction itself, tracking buildout progress against the schedule. Sensor choice by project stage is discussed in “How to choose satellite data for energy“.

My passions are Earth Observation and Satellites, and my profession is Data Analysis. I combine both within ObservationData.com to show you the use cases of Earth Observation, to help you find the right provider, and to share your experiences.
